Market suffers after over $100 million Bitcoin “long positions” got liquidated

History repeats itself once again, as market liquidations force Bitcoin to make a swift downturn. Market observers noted this when the benchmark cryptocurrency lost traction after its upswing above $60,000.
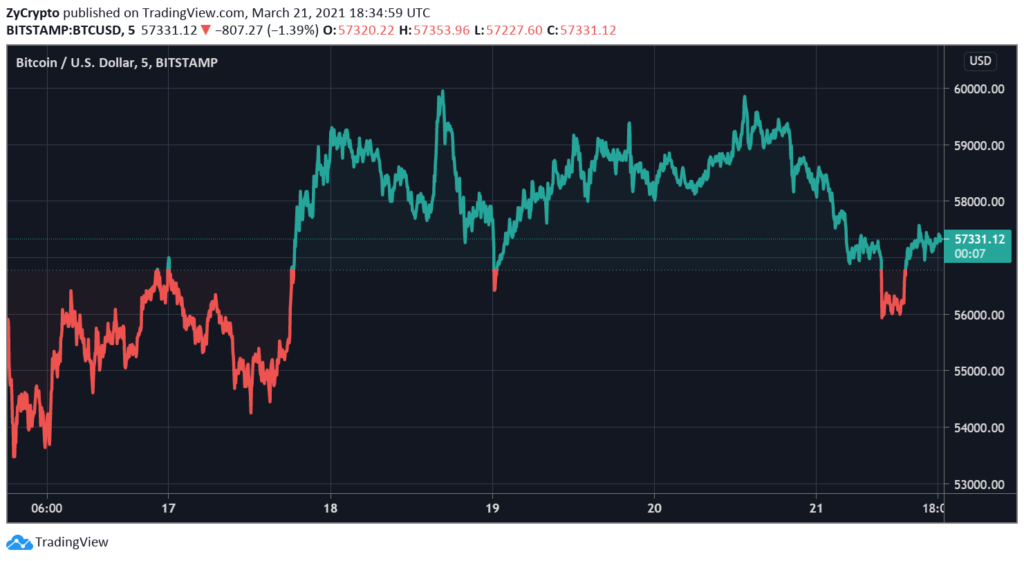
Bitcoin shaved over 5% off its value in the same day, dropping to a daily low of $58,213. The Bitcoin bulls made three different attempts to retrace its steps, as it set out for $60,000, but that price level was not attained as Bitcoin peaked at $59,400.
Not long after, Bitcoin dipped slightly, as a light bearish wave hit the flagship asset, sending it down to a low of $56,000. At the time of this report, Bitcoin is down by 4%, thanks to its mild correction. The dominant cryptocurrency is now trading at a price of $57,318.
Expectations of the bear market storm subsiding is not a sentiment shared by Bitcoin analysts, who rightfully noted that the asset is suffering from the effects of the recent million-dollar liquidation recorded in the market.
On-chain analytics site Glassnode captured the event in real-time, showing in the chart below how $130 million futures long positions were liquidated in ten minutes. Up till present, there are countless reasons to remain bullish on Bitcoin, but the reoccurring pattern of intense liquidation hints that it may get extremely dark before the market reaches the end of the tunnel.
Almost like Déjà vu, the same pattern of liquidation sent Bitcoin downhill. As we reported previously, an intense selloff took place as 185,350 trades worth $2.2 billion were liquidated in 24hours which saw Bitcoin make a sharp correction to $55,000. This was just a day after Bitcoin set a new price high of $61,923.
But as we noted earlier, the bullish reasons to not close the chapter on the asset are more than a handful. In fact, they seem to outweigh the bear trend in the long term. To begin with, the $1 trillion Bitcoin market cap has already been validated by investors, according to an on-chain analysis from Willy Woo’s assessment. This means that Bitcoin may likely never see the market cap go below that level.
Meanwhile, the URPD indicator does not capture the internal movement of assets as Woo noted below:
“URPD is a lens into price discovery by showing the price when coins last moved assuming they were bought by investors. Be aware coin movements are not always from purchases. For example, exchanges and users regularly move coins internally.”
However, it still shows that holders are in for the long term. As 28% of Bitcoin only moved after the asset broke past $19,000. This reassures us that market players are committed to holding through the bearish trend.
Source: Read Full Article

