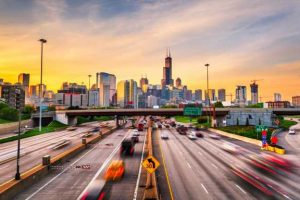
The Worst City to Drive in Every State

Millions of Americans began working from home during the pandemic, but millions others continued to commute to work every day. Now that offices are opening up again, more Americans will be joining them, with many dreading the commute. The average drive to work is 27.6 minutes, but in some parts of the country this commute can take much longer.
Driving on major highways packed with commuters can also be dangerous, as traffic accidents can occur. While every major city is bound to have some traffic, each state has at least one major metropolitan area in which driving is especially time consuming, expensive, and dangerous.
To determine the worst cities to drive in, 24/7 Wall St. created an index assessing the safety, cost, and convenience of driving in America’s metropolitan statistical areas.
Traffic congestion is the result of too many cars on the road and not enough roadway. And certain times, such as commute time, lend themselves to more traffic congestion. Most of the worst cities to drive in each state are metro areas with populations of well over 1 million people, making them among the largest population centers in the country.
Major metro areas tend to have better public transit options. Yet the vast majority of the cities that rank as the worst to drive in their state have a relatively high share of commuters who drive their own car to work compared to the nationwide share of 84.8%.
Traffic jams can not only rob commuters of dozens of hours per year, but also cost them hundreds of dollars annually in wasted fuel and lost productivity. Longer commutes can also result in more wear and tear on a car, so car buyers must ensure they get a vehicle that can stand up to the rigors of their commute. These are the most and least dependable cars for 2021.
Click here to see the worst city to drive in every state
To determine the worst cities to drive in, 24/7 Wall St. created an index assessing the safety (number of traffic fatalities), cost (fuel cost, hours spent in traffic), and convenience (travel time) of driving in America’s metropolitan statistical areas.
Data on the number of traffic fatalities in 2019 came from the Fatality Analysis Reporting System and was adjusted for population using data from the U.S. Census Bureau’s 2019 American Community Survey. Data on the mean travel time to work for the population 16 years and over came from the 2019 ACS. Data on the average cost of fuel per auto commuter accrued while sitting in traffic in 2020, as well as the average number of hours of delay spent in traffic per auto commuter in 2020, came from the Texas A&M Transportation Institute’s 2021 Urban Mobility Report and were aggregated from the urban area level to the metropolitan statistical area level using geographic definitions from the Census Bureau.
Supplemental data included the number of car thefts per 100,000 people came from the National Insurance Crime Bureau’s 2019 Hot Spots Vehicle Theft Report as well as data on the average annual insurance costs by state. Insurance cost data came from car review website insure.com and are based on full coverage for a single, 40 year-old male with a clean record and good credit and are for the 2021 model-year versions of the 20 best-selling vehicles in the United States as of January 2021.
Source: Read Full Article
