Bitcoin Regains Bullish Momentum, Revisits the $35,000 Resistance Level

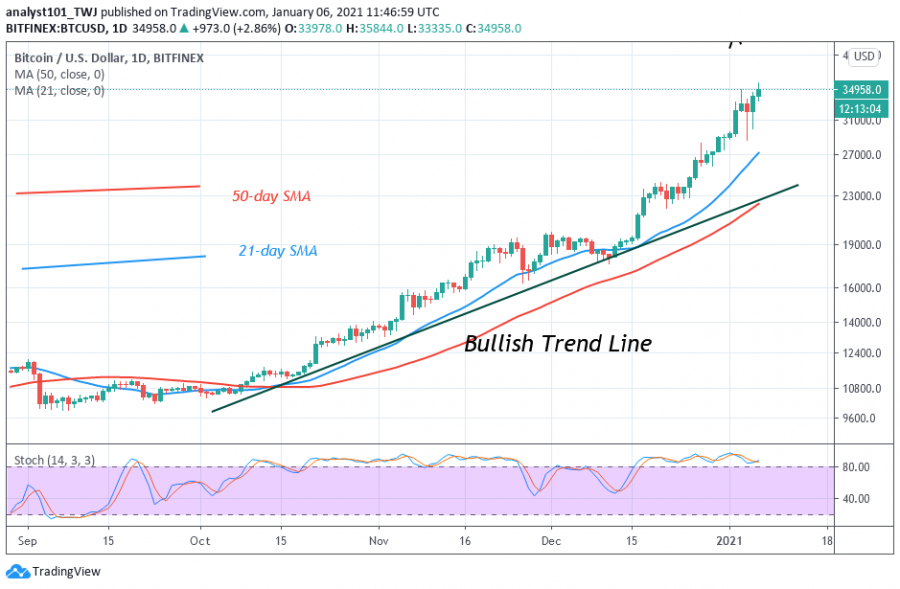
Bitcoin price retested the $35,000 resistance level but failed to continue the upward move. The crypto is likely to correct on the downside.
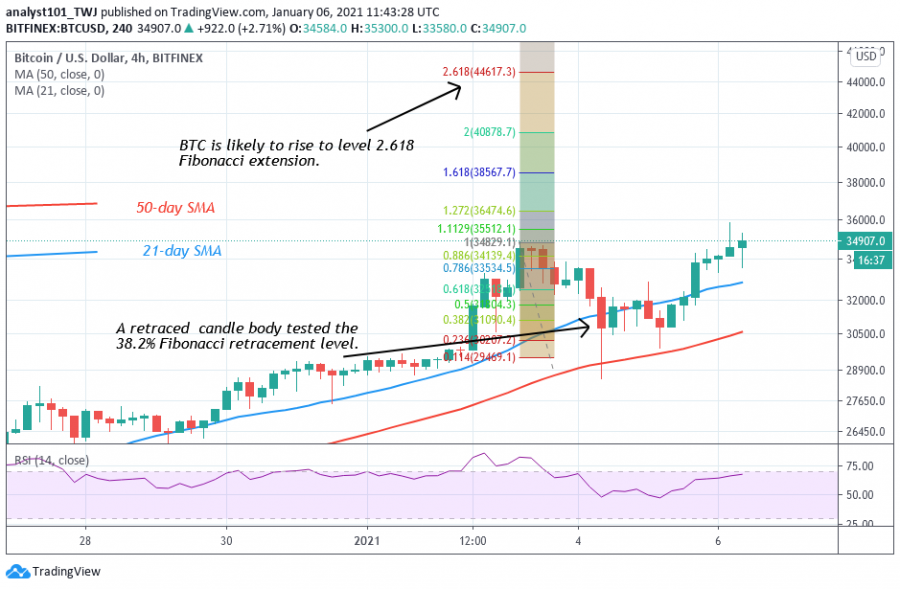
The reason for the retracement is because the crypto’s price has reached an overbought region of the market. The RSI and the stochastic have indicated the overbought condition of the coin. Bitcoin is at level 85 of the RSI which implies that it has no room to rally on the upside.
On January 3, Bitcoin bulls had earlier retested the resistance zone and the coin plunged to $28,540 low. The breakdown on January 4 liquidated traders who are long trades. Surprisingly, the market moved up immediately to retest the same resistance. Today, the BTC price has reached a new high of $35,844. Traders and investors have assumed that when Bitcoin makes a new high, the king coin will make some form of correction. This correction gives room for a further upward move.
Bitcoin indicator reading
As the crypto retraces today, the candlestick long wick is pointing upward. The long wick is indicating that there is strong selling pressure at the higher price level. The RSI and Stochastic indicators are horizontally flat in the overbought region.
Key Resistance Zones: $40,000, $41,000, $42,000
Key Support Zones: $20,000, $19,000, $18,000
What is the next direction for BTC/USD?
As Bitcoin reached a new high of $35,844, a further upward move is likely. On January 3 uptrend; a retraced candle body tested the 38.2% Fibonacci retracement level. The retracement gives the impression that BTC will rise and reach a high of 2.618 Fibonacci extensions. That is a high of $44,617.30.
Disclaimer. This analysis and forecast are the personal opinions of the author that are not a recommendation to buy or sell cryptocurrency and should not be viewed as an endorsement by CoinIdol. Readers should do their own research before investing funds.
Source: Read Full Article


