BNB Holds Existing Support But Struggles Below $260 High

Cryptocurrency analysts of Coinidol.com report, the BNB price continues to range above the $220 support level.
BNB price long term forecast: fluctuation range
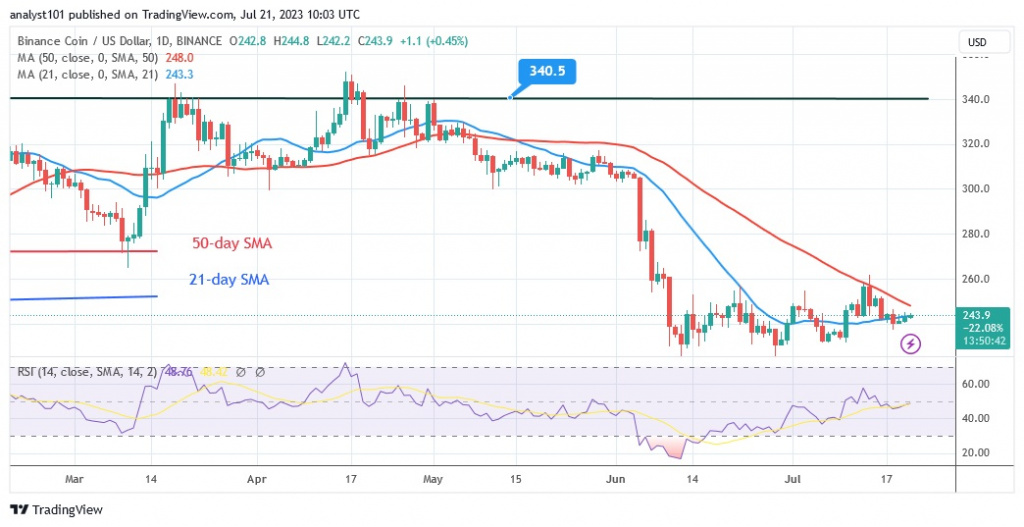
On July 13, buyers unsuccessfully tried to hold the price above $260. The barrier at $260 and the 50-day line SMA stopped the upward movement.
Nonetheless, BNB found support above $230 and started to rise above the current support within a trading range. Price action is currently unchanged as the altcoin continues to trade in a range between $220 and $260. On the downside, buyers have defended the existing support as shown by the long candlestick tails. Long candlestick tails indicate strong buying at lower price levels.
BNB indicator display
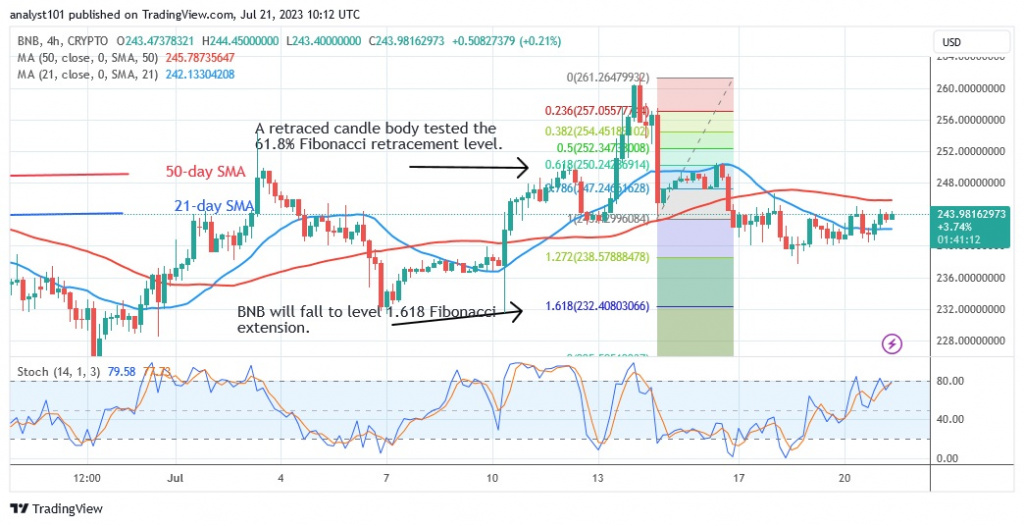
BNB is at an equilibrium price level corresponding to Relative Strength Index value 49 for period 14. It is said that supply and demand are in equilibrium. The price of the cryptocurrency oscillates below and above the moving average lines. The cryptocurrency is rising above the daily stochastic value 80. The market has reached the overbought area. If it approaches the overbought area, the altcoin could fall.
Technical Indicators:
Key resistance levels – $300, $350, $400
Key support levels – $200, $150, $100
What is the next direction for BNB/USD?
BNB price is moving in a range in the lower part of the chart, the barrier of $260 has stopped the upward movement of the price. BNB is still range bound today. Once traders break the fluctuation range, the cryptocurrency asset will develop a trend. The altcoin is currently consolidating above the $230 support level.
Disclaimer. This analysis and forecast are the personal opinions of the author and are not a recommendation to buy or sell cryptocurrency and should not be viewed as an endorsement by CoinIdol.com. Readers should do their research before investing in funds.
Source: Read Full Article


