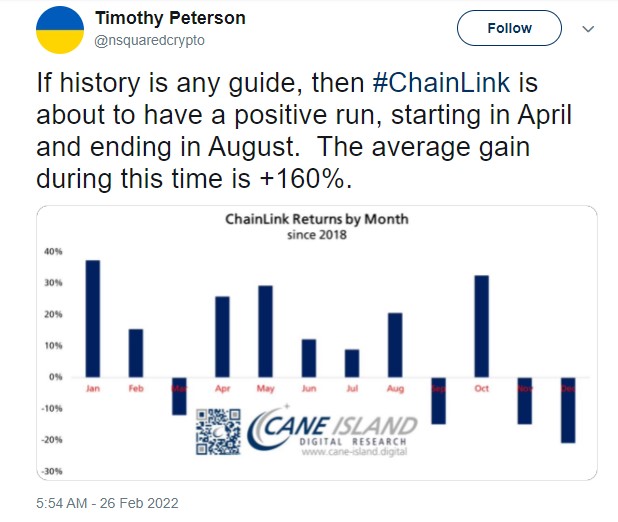
Chainlink Could Have a Positive Run Between April and August

What the Daily LINK/USDT Chart Says
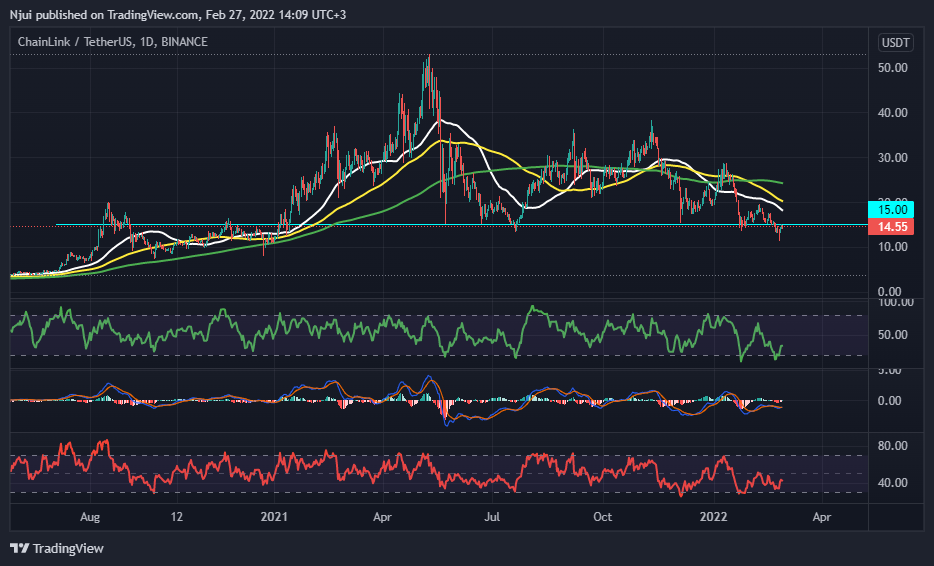
A quick glance at the daily LINK/USDT chart below reveals that Chainlink is currently on a path towards reclaiming the crucial $15 price as support. This is after the digital asset hit a local low of $11.40 following the crypto market selloff as a result of Russian forces entering Ukraine earlier this week.
From the chart, it can be observed that Chainlink’s current price was last witnessed in July 2021 and January 2021. Furthermore, Chainlink is in bear territory as it is trading below the 50-day moving average (white), 100-day moving average (yellow), and 200-day moving average.
However, the daily MFI, MACD, and RSI are hinting at an oversold scenario that could point towards a trend reversal by Chainlink (LINK) in the days to follow.
Caution is Advised When Trading Chainlink During the Russia/Ukraine Crisis
Doing the math a 160% price increment from the local low of $11.40 translates to a value of roughly $30 if Mr. Peterson’s forecast plays out in the stated time period.
However, traders are reminded that the crypto and traditional markets are very volatile given the geopolitical tensions between Russia and Ukraine. Wars cause inflation as well as panic selling as investors try to protect their hard-earned capital from the fluctuating markets.
Source: Read Full Article


