Ethereum Rebounds above $4,000 Support, May Resume Upside Momentum

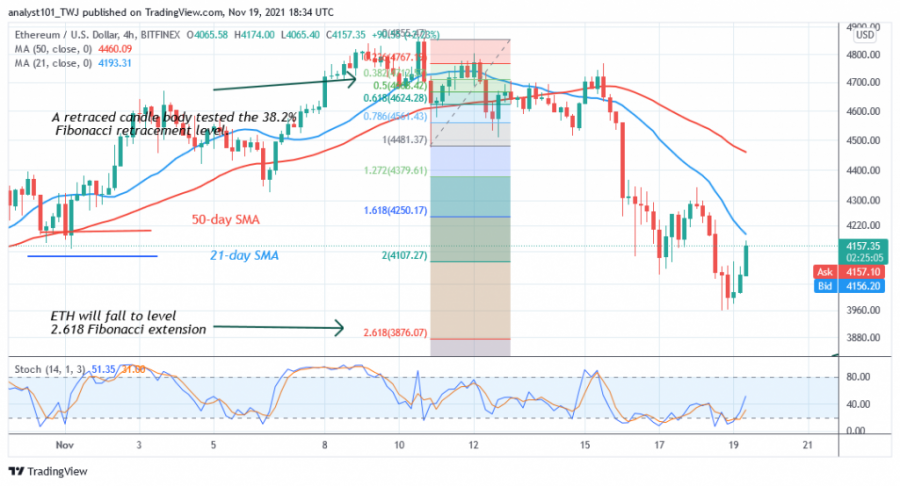
The price of Ethereum (ETH) plummeted as it fell below its moving averages. The largest altcoin has fallen to the low of $3,959 as bulls bought the dips. Today, Ether is moving above $4,000 support.
There is a possibility of further decline as Ether is trading in the bearish trend zone. In the past 48 hours, the cryptocurrency fluctuated above the current support to break it. This current support is the historical price level from September 3. The altcoin will continue to fall to $3,750 if selling pressure picks up. Conversely, if Ether rallies above the current support, it will break out above the 50-day moving average. The market will continue to move higher as it reaches previous highs.
Ethereum indicator analysis
The cryptocurrency is at the 40 level of the Relative Strength Index for the 14 period. Ether is in the bearish trend zone and is capable of further downward movement. The altcoin is below the 20% area of the daily stochastic. Stochastic bands are sloping horizontally as the market reaches bearish exhaustion.
Technical indicators:
Major Resistance Levels – $4,500 and $5,000
Major Support Levels – $3,500 and $3,000
What is the next direction for Ethereum?
On the 4-hour chart, Ethereum has dropped significantly to the downside. The current downtrend has reached bearish exhaustion. Meanwhile, on November 10, the downtrend has seen a retracement candlestick testing the 38.2% Fibonacci retracement level. The retracement suggests that Ethereum will fall to the 2,618 Fibonacci Extension level or $3,876.07.
Disclaimer. This analysis and forecast are the personal opinions of the author and are not a recommendation to buy or sell cryptocurrency and should not be viewed as an endorsement by CoinIdol. Readers should do their research before investing funds.
Source: Read Full Article


