Ethereum Trades Marginally Below $1,600, Unable to Break Recent High

Following its rejection from $1,700 and subsequent fall to $1,300, the biggest altcoin has been confined to trade between $1,300 and $1,600.
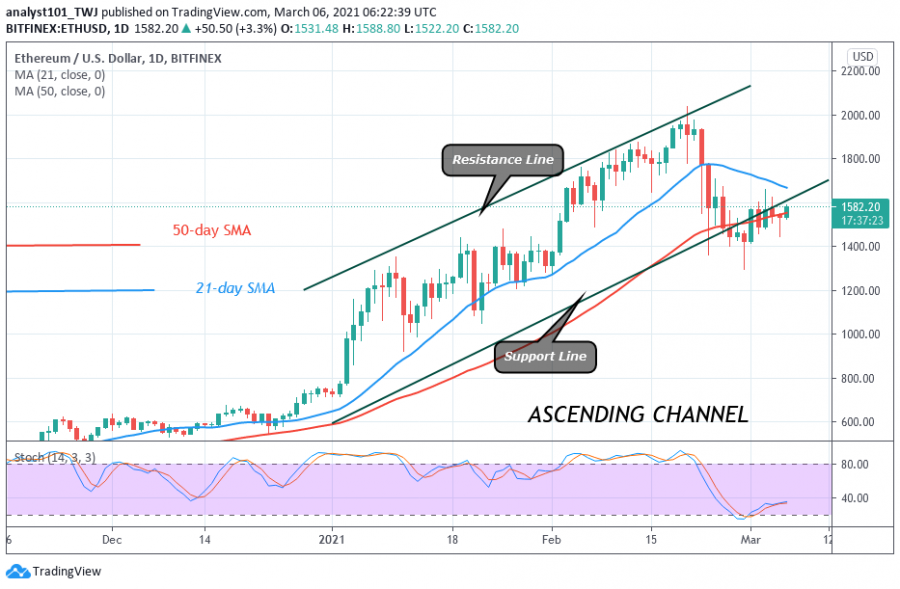
For the past three days, the price movement has been stagnant below the $1,600 resistance. The price action is characterized by small body candlesticks called Doji and Spinning tops. The candlesticks are indicating that buyers and sellers have reached a period of indecision.
This implies that the altcoin will be in range bound movement between $1,300 and $1,600 for a few more days. This period could also be referred to as a period of consolidation. In such a period, a breakout or breakdown cannot be ruled out. A breakout at the $1,600 will amount to retesting the $2,000 overhead resistance. Conversely, a breakdown will sink the ETH/USD to $1,100 low. Meanwhile, Ether is trading at $1,542 at the time of writing.
Ethereum indicator analysis
The price has broken below the 21-day and 50-day SMAs which indicates that Ether has fallen into the bearish trend zone. Also, it means that the altcoin is capable of further decline. Also, the price is at level 46 of the Relative Strength Index period 14. It indicates that Ether is in the downtrend zone and below the centerline 50.
Technical indicators:
Major Resistance Levels – $2,500 and $2,700
Major Support Levels – $1.500 and $1,300
What is the next direction for Ethereum?
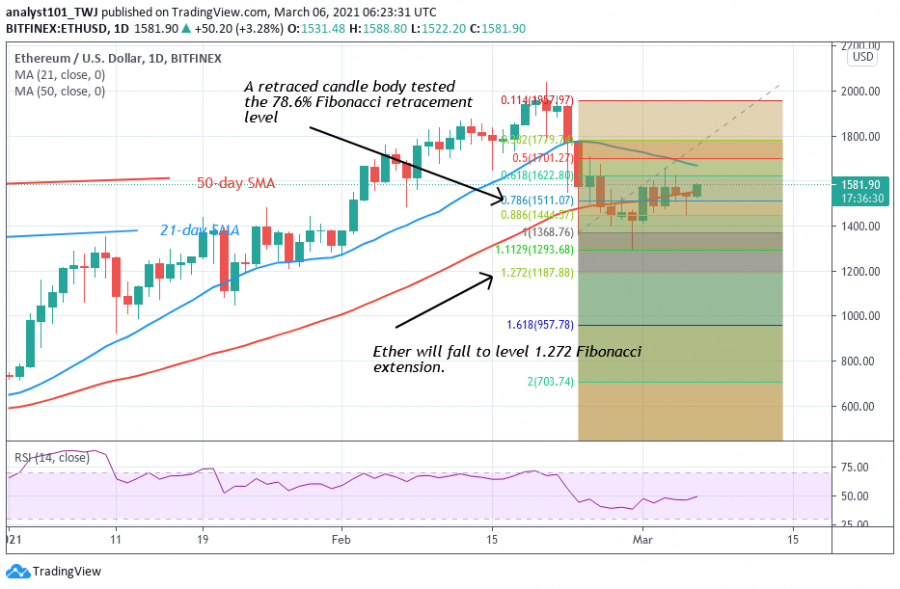
As the market fluctuates in a tight range, there is a tendency for prices to fall. On February 23 downtrend; a retraced candle body tested the 78.6% Fibonacci retracement level. The retracement indicates that ETH will fall and reverse at level 1.272 Fibonacci extension or the low of $1,187.88.
Disclaimer. This analysis and forecast are the personal opinions of the author that are not a recommendation to buy or sell crypto currency and should not be viewed as an endorsement by CoinIdol. Readers should do their research before investing funds.
Source: Read Full Article


