Polkadot Trades Marginally, Unable to Sustain Above the Overhead Resistance at $34

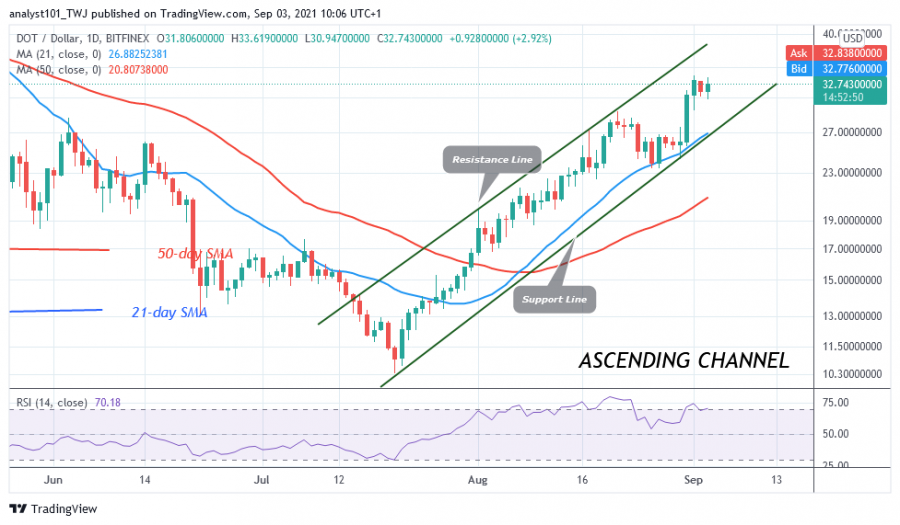
The price of Polkadot (DOT) has risen to a high of $33.80, but the bullish momentum has not been sustained. In the last 48 hours, DOT/USD has been fluctuating below the $34 resistance level.
Buyers have made concerted efforts to break above the resistance level. Polkadot has reached the overbought area of the market. Therefore, further upward movement is limited. Price action will be marginal above the resistance level. Sellers will emerge and push the price into the range-bound zone. However, the price of DOT is likely to fall when the sellers show up in the overbought region. On the downside, the market will fall to the low of $30 if the altcoin is rejected at the recent high.
Polkadot indicator analysis
The cryptocurrency is at the 70 level of the Relative Strength Index of period 14. Polkadot is already in the overbought zone of the market. The price of DOT is above the 80% range of the daily stochastic. The daily stochastic shows that the market has reached the overbought area. The 21-day and 50-day SMAs are sloping upward, indicating an uptrend.
Technical indicators:
Major Resistance Levels – $48, $52, $56
Major Support Levels – $32, $28, $24
What is the next direction for Polkadot?
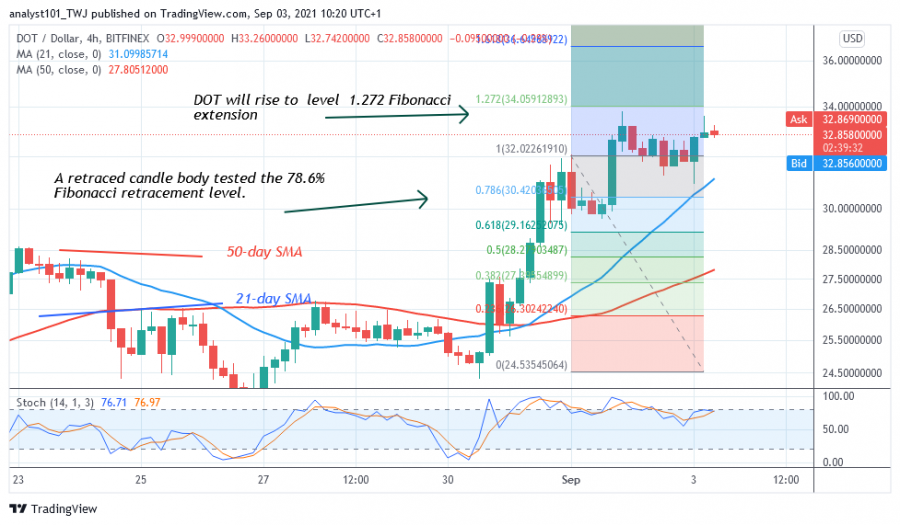
Polkadot’s upside is just above the recent high. Sellers will resist any upward movement. Meanwhile, the September 1 uptrend has a candlestick body testing the 78.6% Fibonacci retracement level. The retracement suggests that the price of DOT will rise but reverse at the 1.272 Fibonacci extension level or at the $34.05 level.
Disclaimer. This analysis and forecast are the personal opinions of the author and are not a recommendation to buy or sell cryptocurrency and should not be viewed as an endorsement by CoinIdol. Readers should do their research before investing funds.
Source: Read Full Article


