Ripple Is in a Sideways Trend as Buyers Attempt to Breach $1.14 High

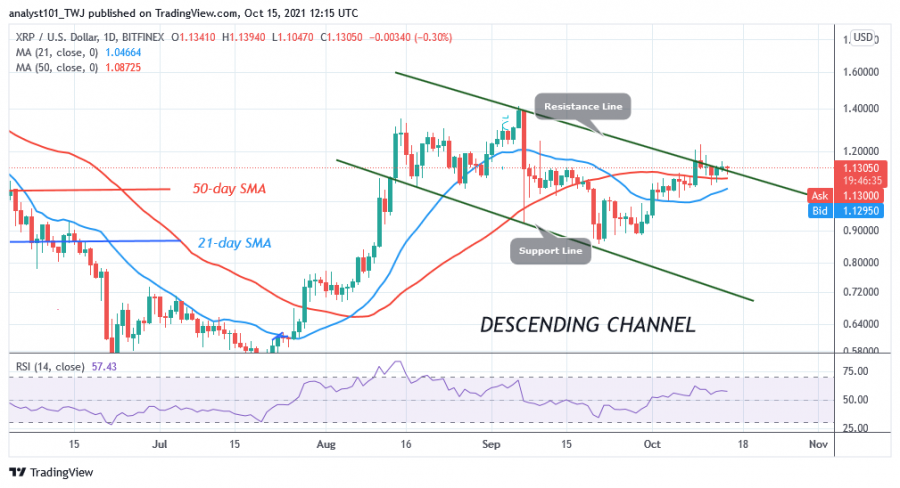
Ripple (XRP) has been in an uptrend for the past three days, but has been forced to move sideways. Currently, the cryptocurrency has been trading between $1.10 and $1.14 since October 13.
Today, the XRP price is trading at $1.13 below its recent high. There is a tendency for the market to rise as XRP is in the bullish trend zone. If the bulls push XRP above the $1.14 resistance, XRP/USD will rise to a high of $1.20. The bullish momentum will extend to the previous high of $1.40. If buyers fail to break the recent high, Ripple will continue to hover between $1.10 and $1.14 for a few more days.
Ripple indicator analysis
Ripple’s price bars are above the 21-day line SMA and the 50-day line SMA, indicating a possible upward movement of the cryptocurrency. This has been confirmed as XRP is at level 57 on the Relative Strength Index for period 14. This means that XRP is in an uptrend and has room to move higher. Currently, the market is above the 70% area of the daily stochastic. This means XRP is in a bullish momentum.
Technical indicators:
Major Resistance Levels – $1.95 and $2.0
Major Support Levels – $0.80 and $0.60
What is the next move for Ripple?
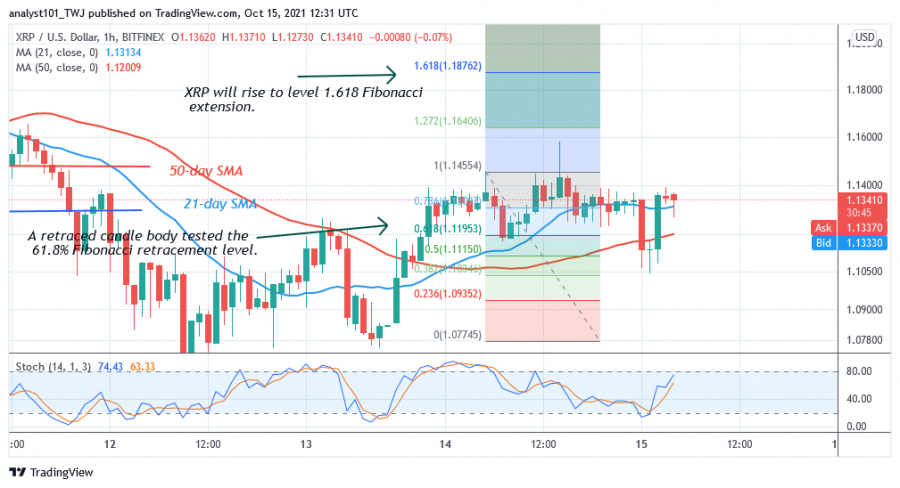
On the 1-hour chart, XRP/USD is in an uptrend. However, the uptrend is short-lived as it faces rejection at $1.14. Meanwhile, the uptrend from October 14 has a candle body testing the 61.8% Fibonacci retracement level. The retracement suggests that the XRP price is likely to rise to the Fibonacci extension level of 1.618 or $1.18.
Disclaimer. This analysis and forecast are the personal opinions of the author and are not a recommendation to buy or sell cryptocurrency and should not be viewed as an endorsement by CoinIdol. Readers should do their own research before investing.
Source: Read Full Article


