Uniswap Turns Down From $6.50 And Continues A Sideways Movement

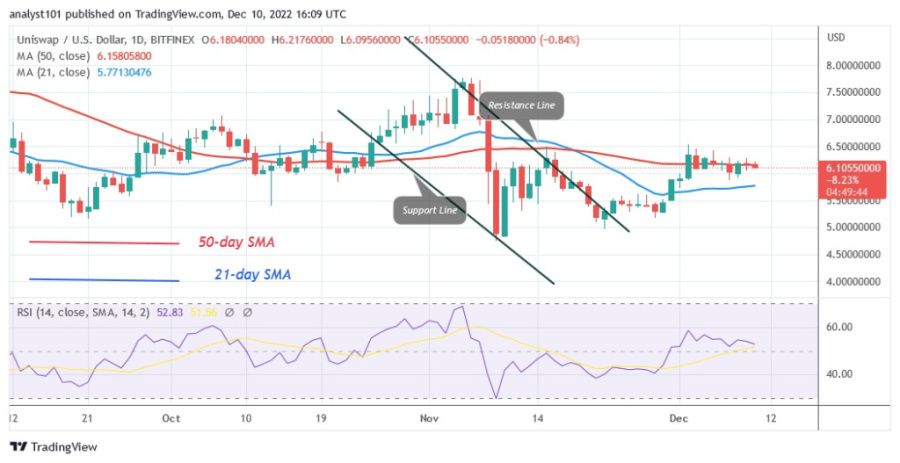
Uniswap (UNI) price is falling while correcting upwards. The high at $6.50 marks the end of the upward correction. UNI is now fluctuating below the recent high, but has fallen below the 50 line SMA.
Uniswap price long term forecast: bearish
The cryptocurrency will likely be trapped in a range between the moving average lines and forced to move. In other words, UNI will trade in the $5.50 to $6.50 range. On the downside, selling pressure will resume if sellers break the $5.50 support or the 21-day SMA line. The altcoin will then fall back to its previous lows of $4.96 and $4.75.
Uniswap indicator display
The Relative Strength Index is at level 52 for period 14. UNI could continue to rise as it is in a positive trend zone. However, if the altcoin continues to fall, it could slip into negative territory. It will be forced to resume a sideways movement as the price bars are between the moving average lines. The daily chart’s stochastic is 80 below the altcoin, which is experiencing negative momentum.
Technical indicators
Key resistance levels – $18.00 and $20.00
Key support levels – $8.00 and $6.00
What is the next direction for Uniswap?
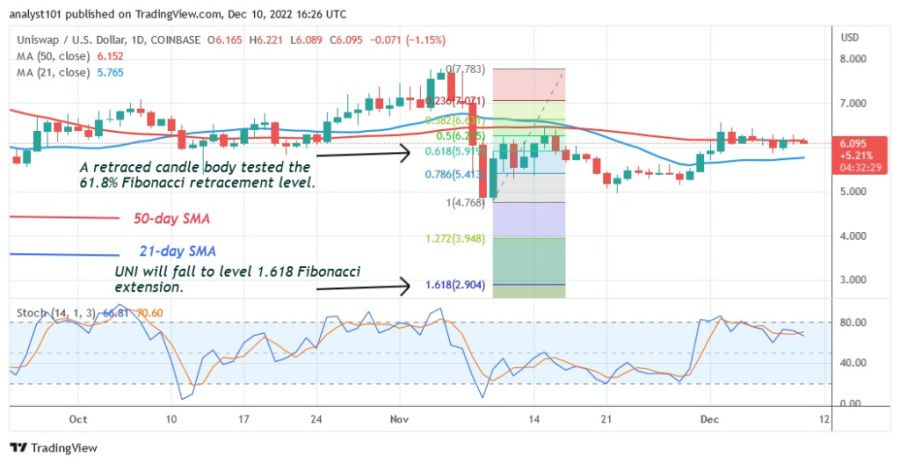
UNI is currently moving sideways after being rejected at the last high. The price indicator has indicated a possible decline in the cryptocurrency. UNI has reversed to the upside during the decline that started on September 9 and a candlestick has tested the 61.8% Fibonacci retracement level. After the correction, UNI will fall to the 1.618 level in the Fibonacci sequence or $2.90.
Disclaimer. This analysis and forecast are the personal opinions of the author and are not a recommendation to buy or sell cryptocurrency and should not be viewed as an endorsement by Coin Idol. Readers should do their own research before investing in funds.
Source: Read Full Article


