Weekly Cryptocurrency Market Analysis: Altcoins Lose Crucial Support Levels But Struggle In Down Zone

The least successful cryptocurrencies are listed below.
Altcoin prices have fallen dramatically and appear to have bottomed out. As long as the cryptocurrency market remains in the downtrend zone, altcoin prices will continue to fall. I will look at each of these cryptocurrencies individually.
Flare
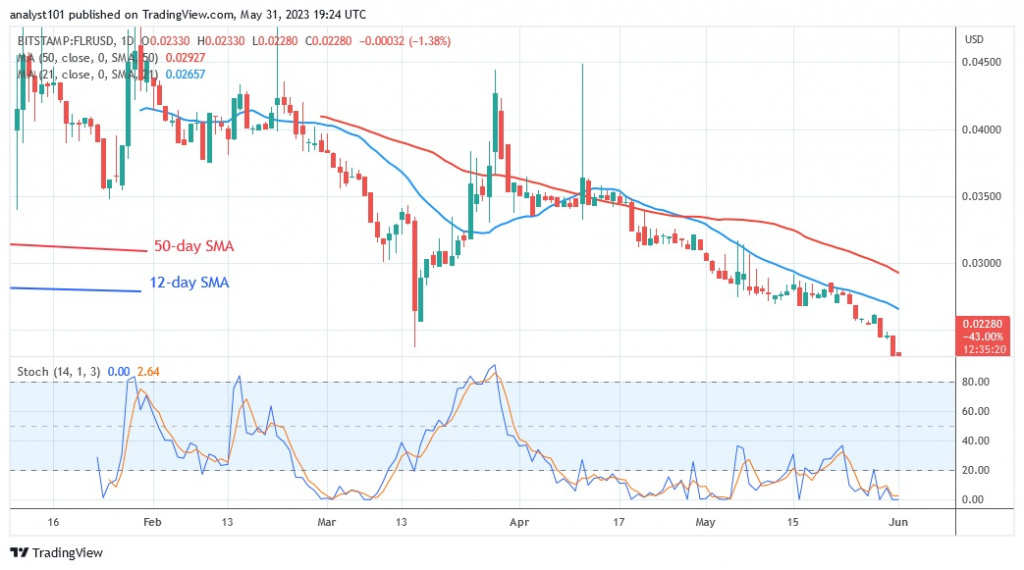
Flare (FLR) is no longer above the moving average lines. The condition has continued to deteriorate since January 12. Buyers persistently tried to keep the price above the $0.04 overhead barrier, but they were not successful. The price of the cryptocurrency has fallen to a record low of $0.02 at the time of this writing. On the downside, the trend is downward and has surpassed the previous low of $0.023. The altcoin market has also reached oversold territory. The bearish momentum is likely to slow down as the market approaches the oversold area. Currently, the daily stochastic is below the level of 20. The cryptocurrency with the following characteristics has performed the worst:
Current price: $0.02286
Market capitalization: $2,310,222,566
Trading volume: $8,065,093
7-day gain/loss: 13.75
Optimism
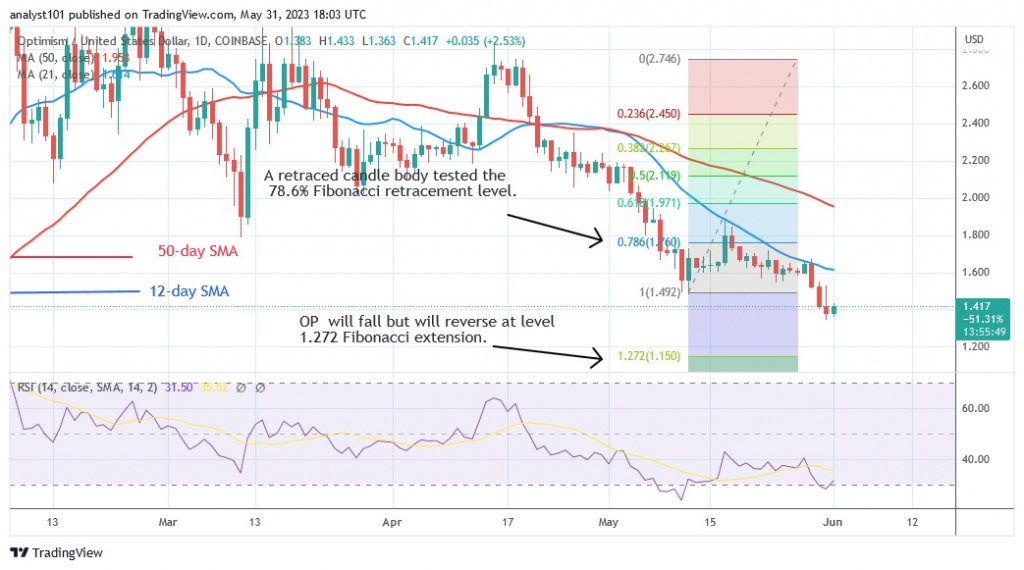
The price of Optimism (OP) is falling below the moving average lines. After the resistance at $1.60 or the 21-day line SMA, the altcoin has come under selling pressure again. The bears have managed to break the current support at $1.49. The price indicator has also shown that the cryptocurrency’s value could fall before it turns around. A candlestick on May 12 tested the 78.6% Fibonacci retracement line as the market fell and OP underwent an upward correction. After the correction, OP will fall but turn around at the 1.272 Fibonacci extension level or $1.15. The market has declined and is approaching the 1.272 Fibonacci extension based on the price movement. The Relative Strength Index for the period 14 is at 28 on OP Optimism is the second worst coin this week. It has the following characteristics: it has the following characteristics:
Current price: $1.41
Market capitalization: $6,073,034,872
Trading volume: $216,473,741
7-day gain/loss: 12.27%
Pepe
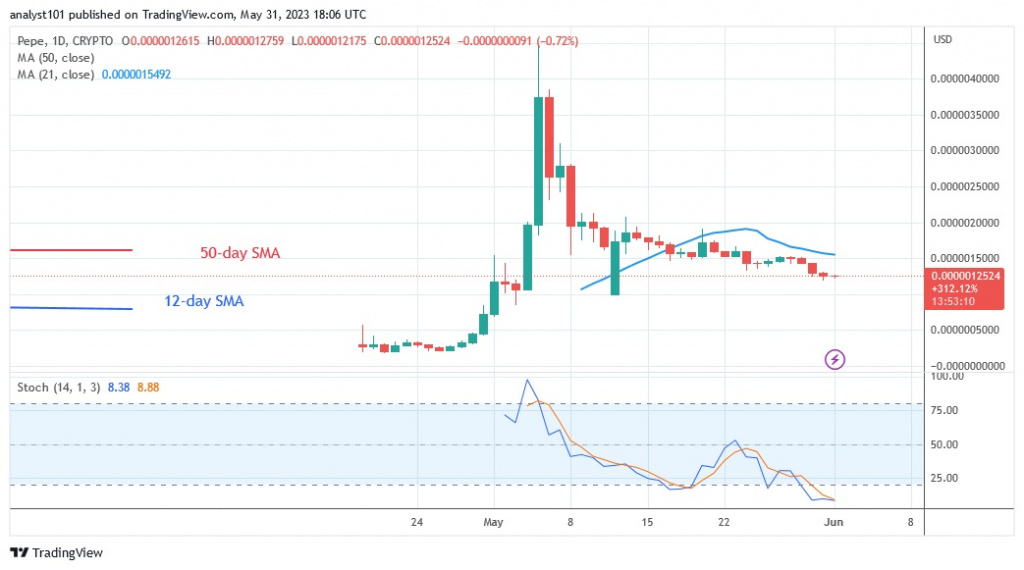
The price of Pepe (PEPE) is currently below its moving average lines. The altcoin’s modest fluctuations between $0.0000010000 and $0.0000020000 indicate that the downtrend has subsided. At the time of writing, PEPE is currently trading at $0.0000013106. The cryptocurrency is rising while in a range. The cryptocurrency value will move once it crosses the boundaries of the trading range. Doji candlesticks are in place, so the price movement has not changed since then. The price of the cryptocurrency has been unstable and bound by the range since then. The coin has fallen into the oversold area of the market. Currently, the daily stochastic is below the level of 20. The characteristics of the cryptocurrency with the third worst performance are as follows.
Current price: $0.000001304
Market capitalization: $546,806,421
Trading volume: $151,287,533
7-day gain/loss: 10.33%
Toncoin
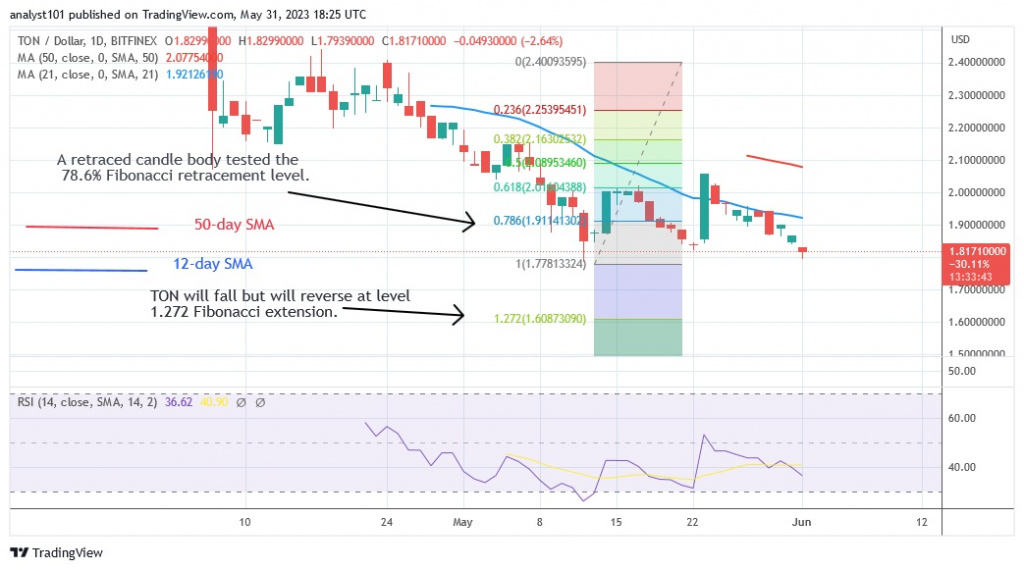
Toncoin (TON) price drops below the moving average lines. Before the selling pressure picked up, the cryptocurrency value tested the $2.40 resistance level twice. At the time of writing, the altcoin had hit a low of $1.79. TON has held above the $1.78 support since May 12. The price indication pointed to additional selling pressure and potential price reversals in cryptocurrencies. A candlestick tested the 78.6% Fibonacci retracement line of the May 12 downtrend in TON, which may be undergoing an upward correction. According to the correction, TON will fall but reverse at the level of 1.272 Fibonacci extension or $1.60. If the current support is broken, the altcoin will fall even lower. The Relative Strength Index for period 14 is at 36 and the cryptocurrency is in the downtrend zone. The fourth worst cryptocurrency is TON. It has these characteristics:
Current price: $1.80
Market capitalization: $9,014,525,941
Trading volume: $9,923,688
7-day gain/loss: 8.37%
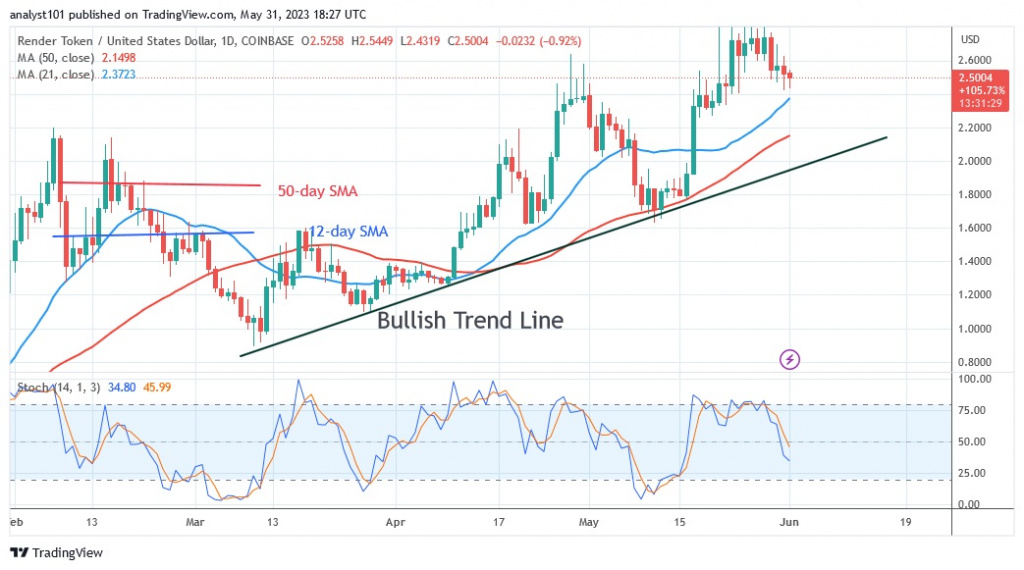
Render Token
Render Token (RNDR) is getting more and more expensive. The price of the cryptocurrency has a series of higher highs and higher lows. The cryptocurrency’s price rose to a high of $2.93 on May 21 before falling. Last week, RNDR bounced around below the $3.00 resistance level. The $3.00 high is the point where the market is overbought. The altcoin is on a pullback to the downside. The current bounce will continue if the price retraces and finds support above the moving average lines. If the price breaks below the moving average lines, the current uptrend will end. RNDR will continue to fall until it reaches its previous low at $1.50 or $1.00. Below the stochastic level of 50 on the daily basis, Render Token is in a negative momentum. At the moment, it is the fifth worst cryptocurrency. It has the following characteristics:
Current price: $2.53
Market capitalization: $1,359,914,534
Trading volume: $1,359,914,534
7–day gain/loss: 7.20%
Disclaimer. This analysis and forecast are the personal opinions of the author and are not a recommendation to buy or sell cryptocurrency and should not be viewed as an endorsement by CoinIdol. Readers should do their own research before investing in funds.
Source: Read Full Article

