Dogecoin Looks Poised to Break Out
Key Takeaways
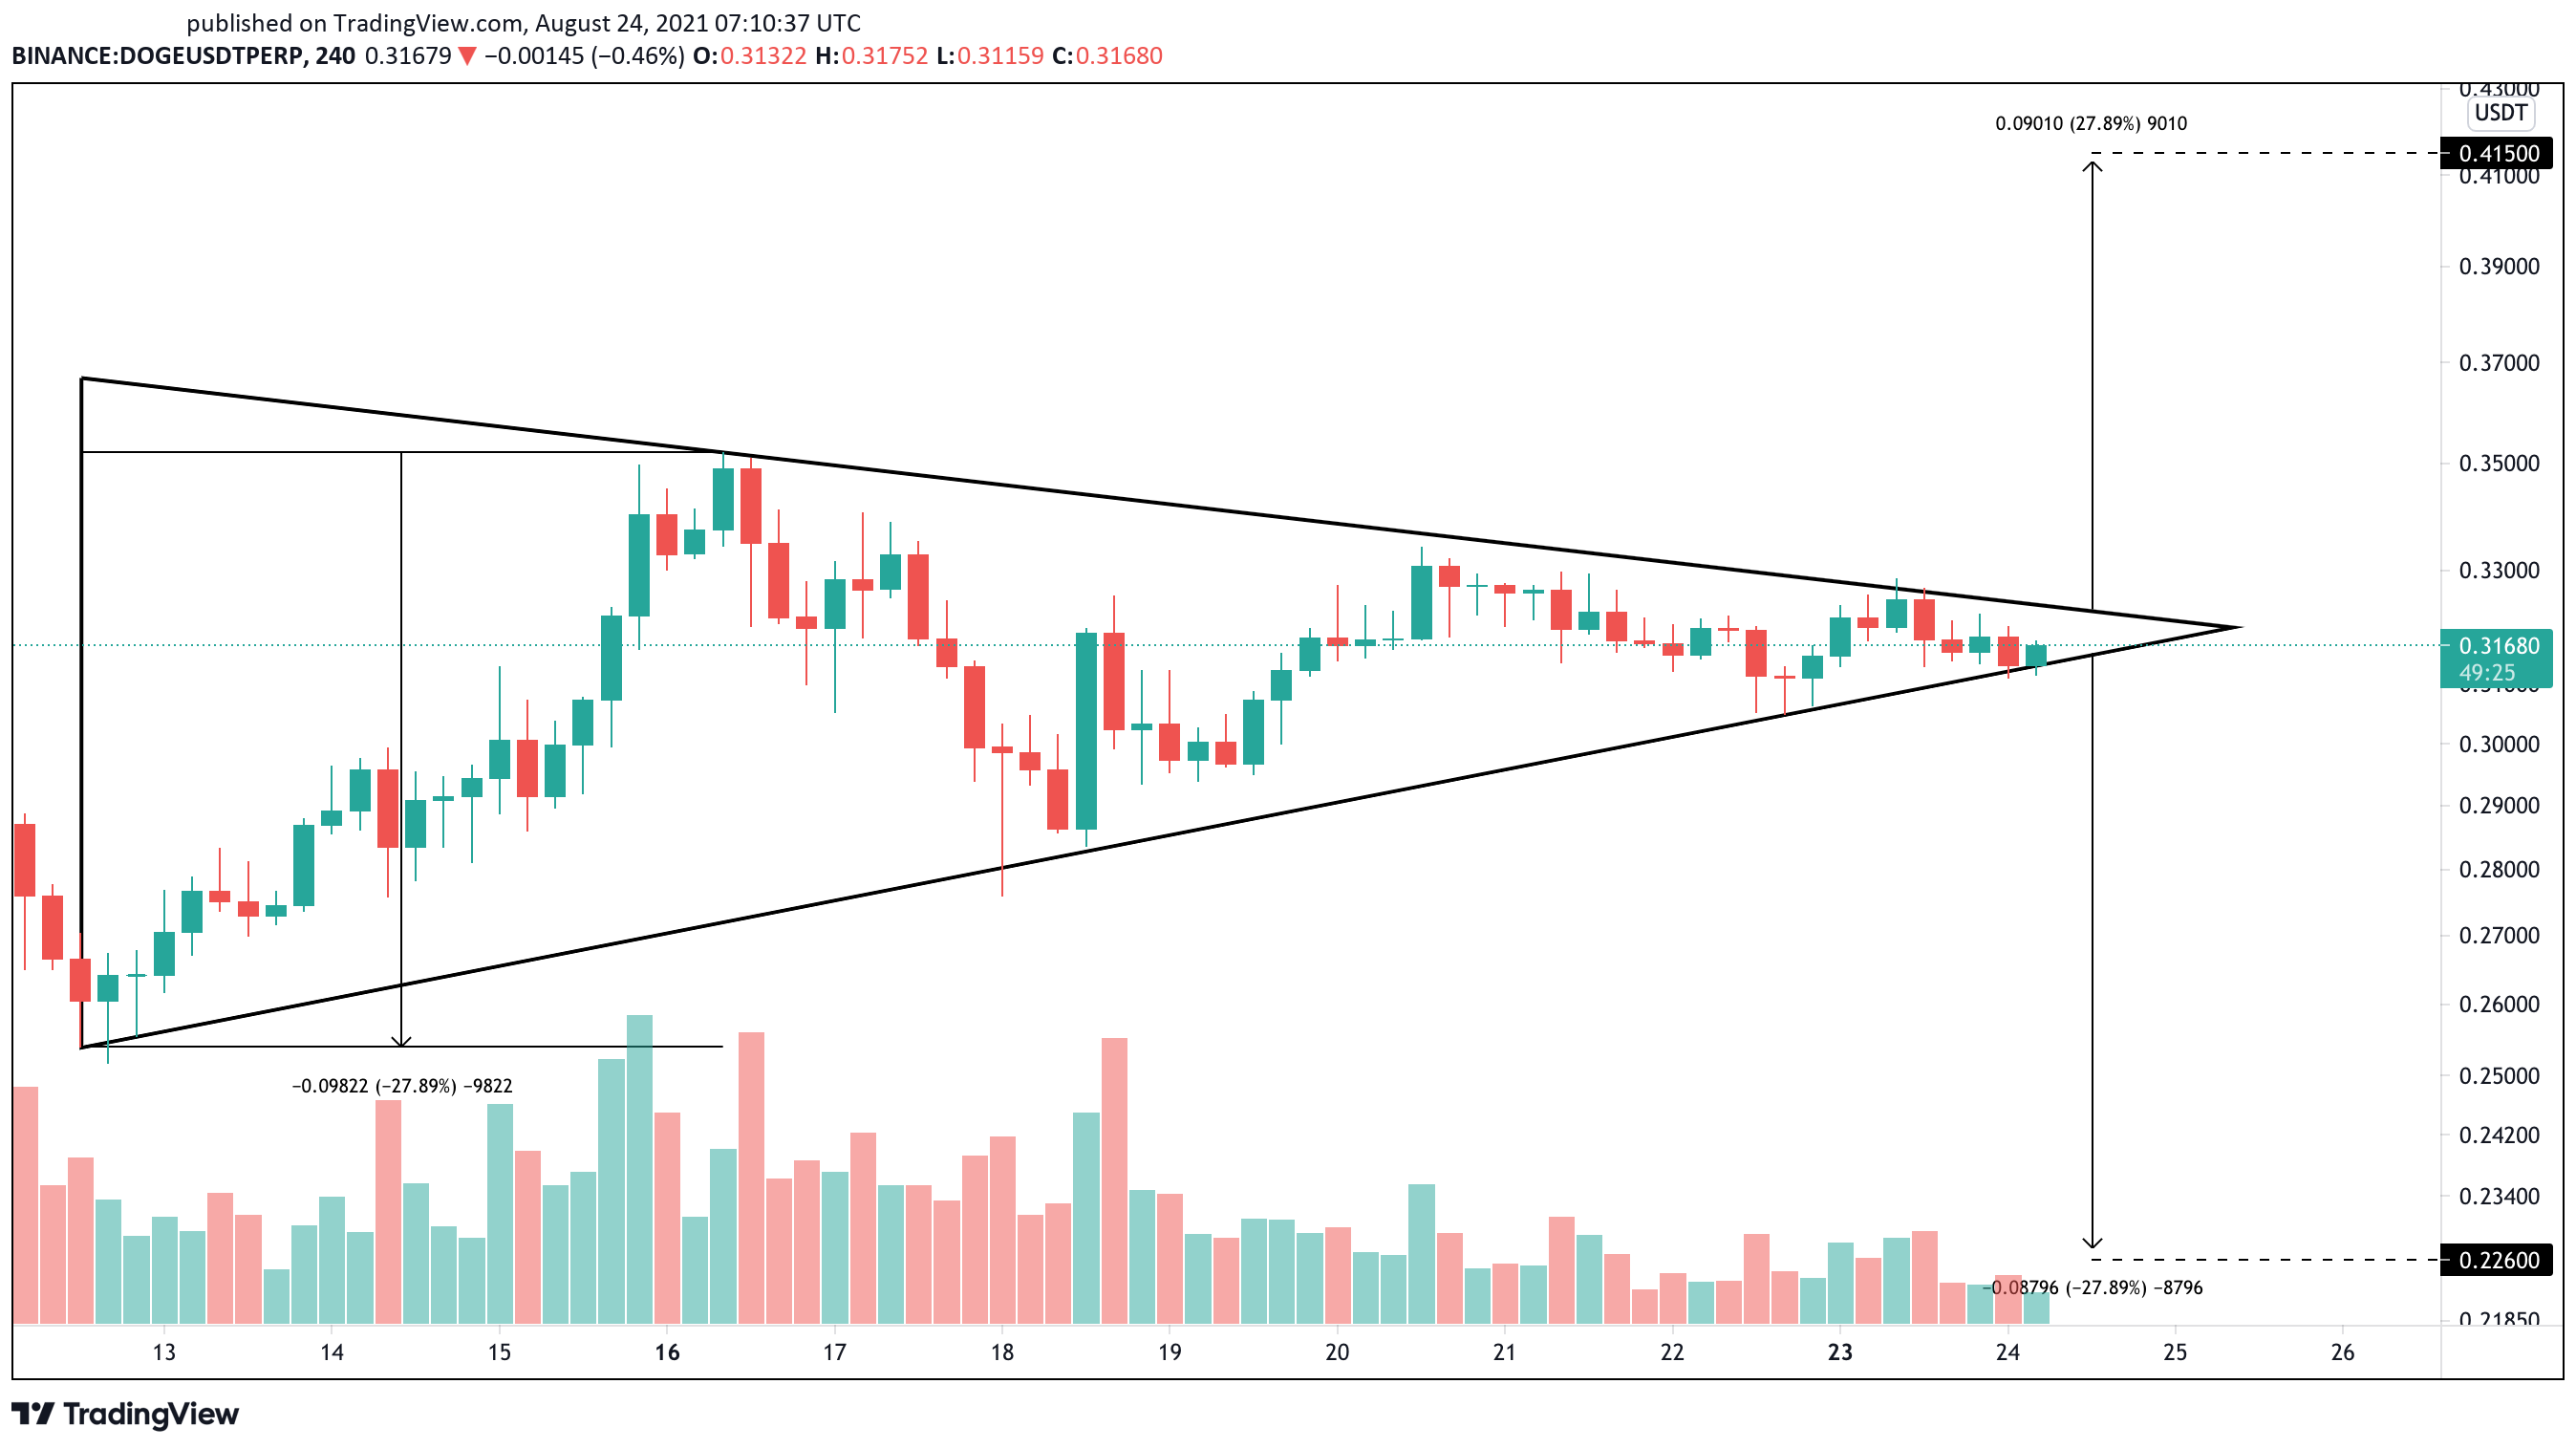
- Dogecoin appears to have developed a symmetrical triangle on its 4-hour chart.
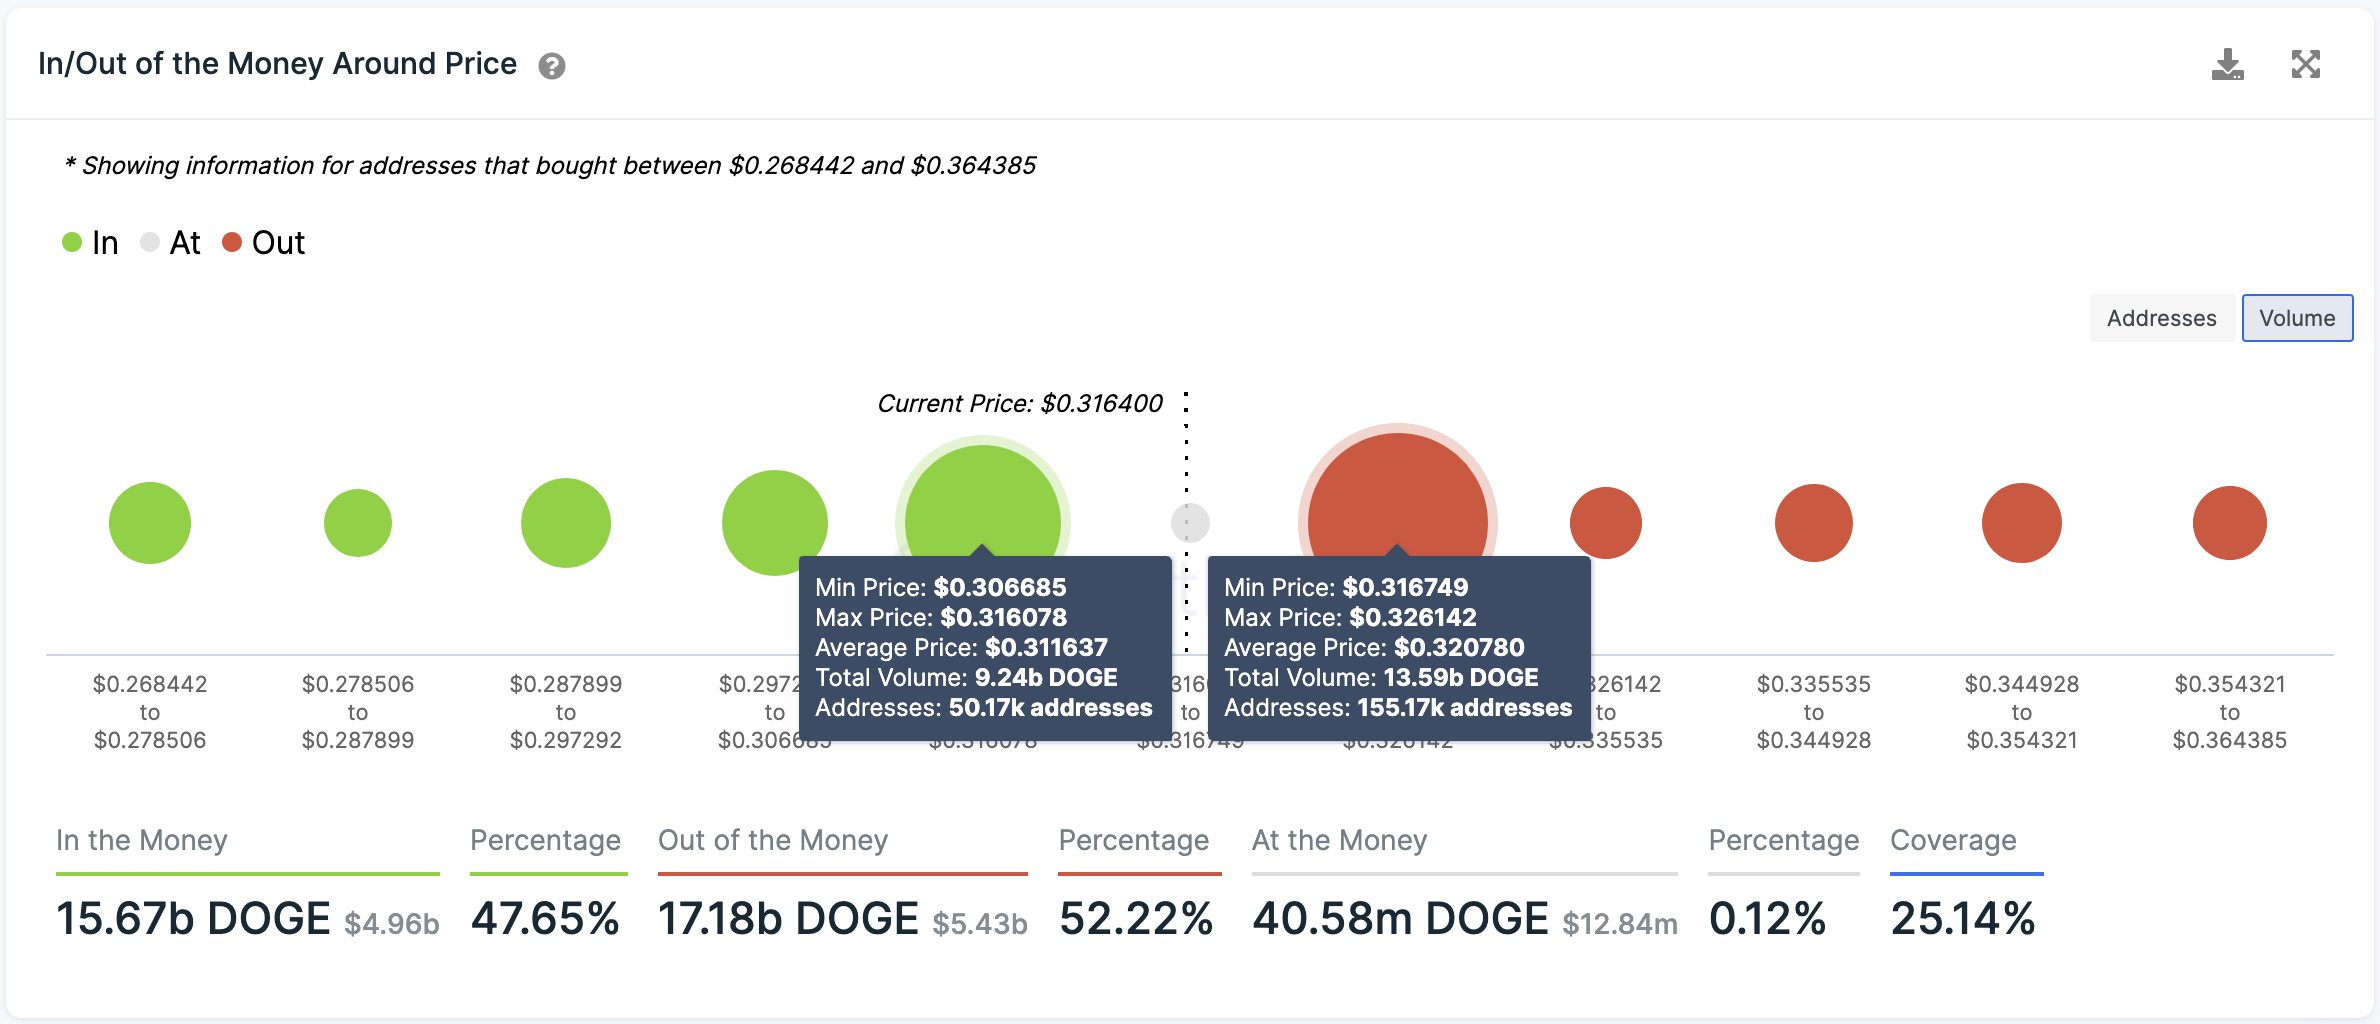
- Transaction history shows that DOGE sits on stable support while facing stiff resistance.
- Only a 4-hour candlestick close above or below the $0.310-$0.326 would determine where prices are heading next.
Dogecoin looks ready for a volatile move as it moves towards the apex of a symmetrical triangle.
Dogecoin Is Primed for Major Move
Dogecoin could be ready for a breakout.
While some altcoins have entered price discovery mode, others continue consolidating within a tight range.
Dogecoin is one of the cryptocurrencies that has considerably slowed down its uptrend. The meme coin has been making a series of lower highs and higher lows since Aug. 12 without providing a clear signal of where it is heading next.
On DOGE’s 4-hour chart, it appears that the recent price action has led to the formation of a symmetrical triangle. As the seventh-largest cryptocurrency by market cap edges closer to the triangle’s apex, it signals that a significant price movement is underway.
A decisive 4-hour candlestick close above or below the $0.310-$0.326 range would likely define Dogecoin’s price trend.
Transaction history shows the importance of the $0.310-$0.326 price range.
Based on IntoTheBlock’s In/Out of the Money Around Price (IOMAP) model, more than 155,000 addresses have previously purchased nearly 13.6 billion DOGE between $0.317 and $0.326. Meanwhile, over 50,000 addresses hold roughly 9.4 billion DOGE purchased between $0.307 and $0.316.
Given the magnitude of this supply zone, it is reasonable to wait for either barrier to be broken before entering any long or short positions.
A sudden increase in buying pressure that allows Dogecoin to slice through the overhead resistance wall could lead to a 28% upswing toward $0.415. But if sell orders begin to pile up and DOGE closes below the underlying support, it could see its price drop to $0.226.
These targets are determined by measuring the triangle’s y-axis and adding it to the breakout point.
The information on or accessed through this website is obtained from independent sources we believe to be accurate and reliable, but Decentral Media, Inc. makes no representation or warranty as to the timeliness, completeness, or accuracy of any information on or accessed through this website. Decentral Media, Inc. is not an investment advisor. We do not give personalized investment advice or other financial advice. The information on this website is subject to change without notice. Some or all of the information on this website may become outdated, or it may be or become incomplete or inaccurate. We may, but are not obligated to, update any outdated, incomplete, or inaccurate information.
You should never make an investment decision on an ICO, IEO, or other investment based on the information on this website, and you should never interpret or otherwise rely on any of the information on this website as investment advice. We strongly recommend that you consult a licensed investment advisor or other qualified financial professional if you are seeking investment advice on an ICO, IEO, or other investment. We do not accept compensation in any form for analyzing or reporting on any ICO, IEO, cryptocurrency, currency, tokenized sales, securities, or commodities.
See full terms and conditions.
Source: Read Full Article


