Solana Dip Leads to $250M Lost in Liquidations

Key Takeaways
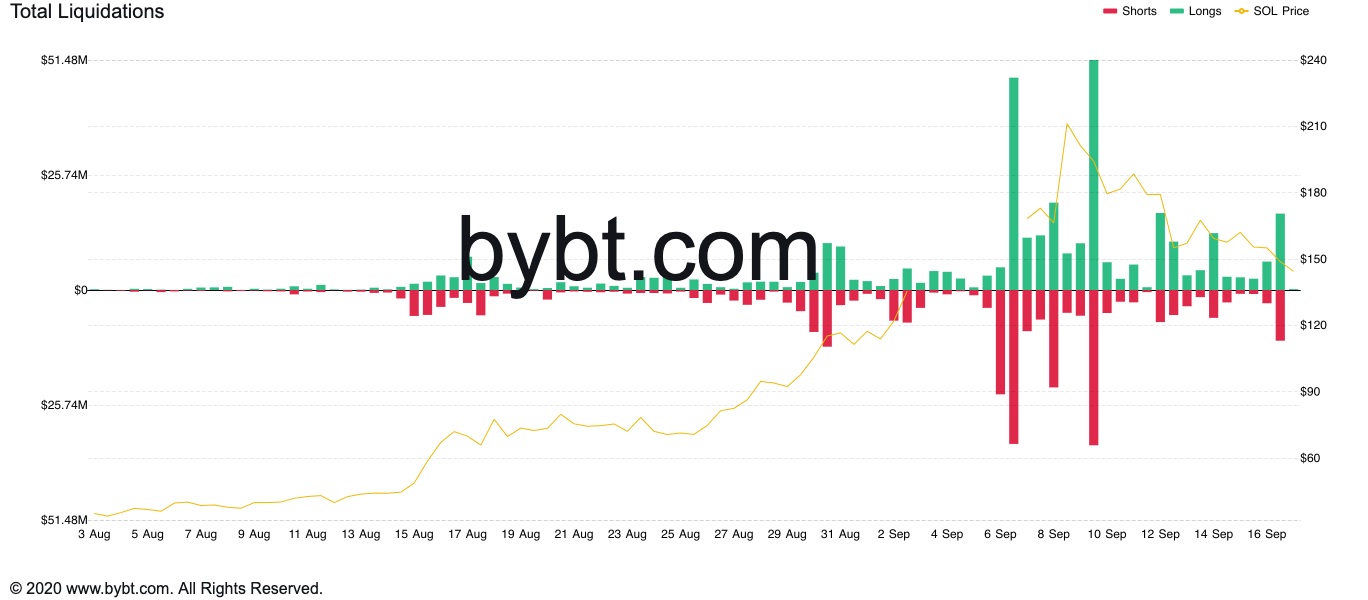
- Solana’s price action has generated more than $250 million in liquidations since the peak, with $27 million lost over the last 24 hours.
- Now, SOL is sitting above a crucial support level that will determine where it heads next.
- If buy orders pile up, it may retest previous all-time highs, but a spike in downward pressure could see it fall to $96.
Many investors have struggled to correctly time Solana’s price action over the last week, incurring $250 million in losses.
Solana Liquidates Bulls and Bears
A Solana dip has led to a massive $250 million worth of liquidations.
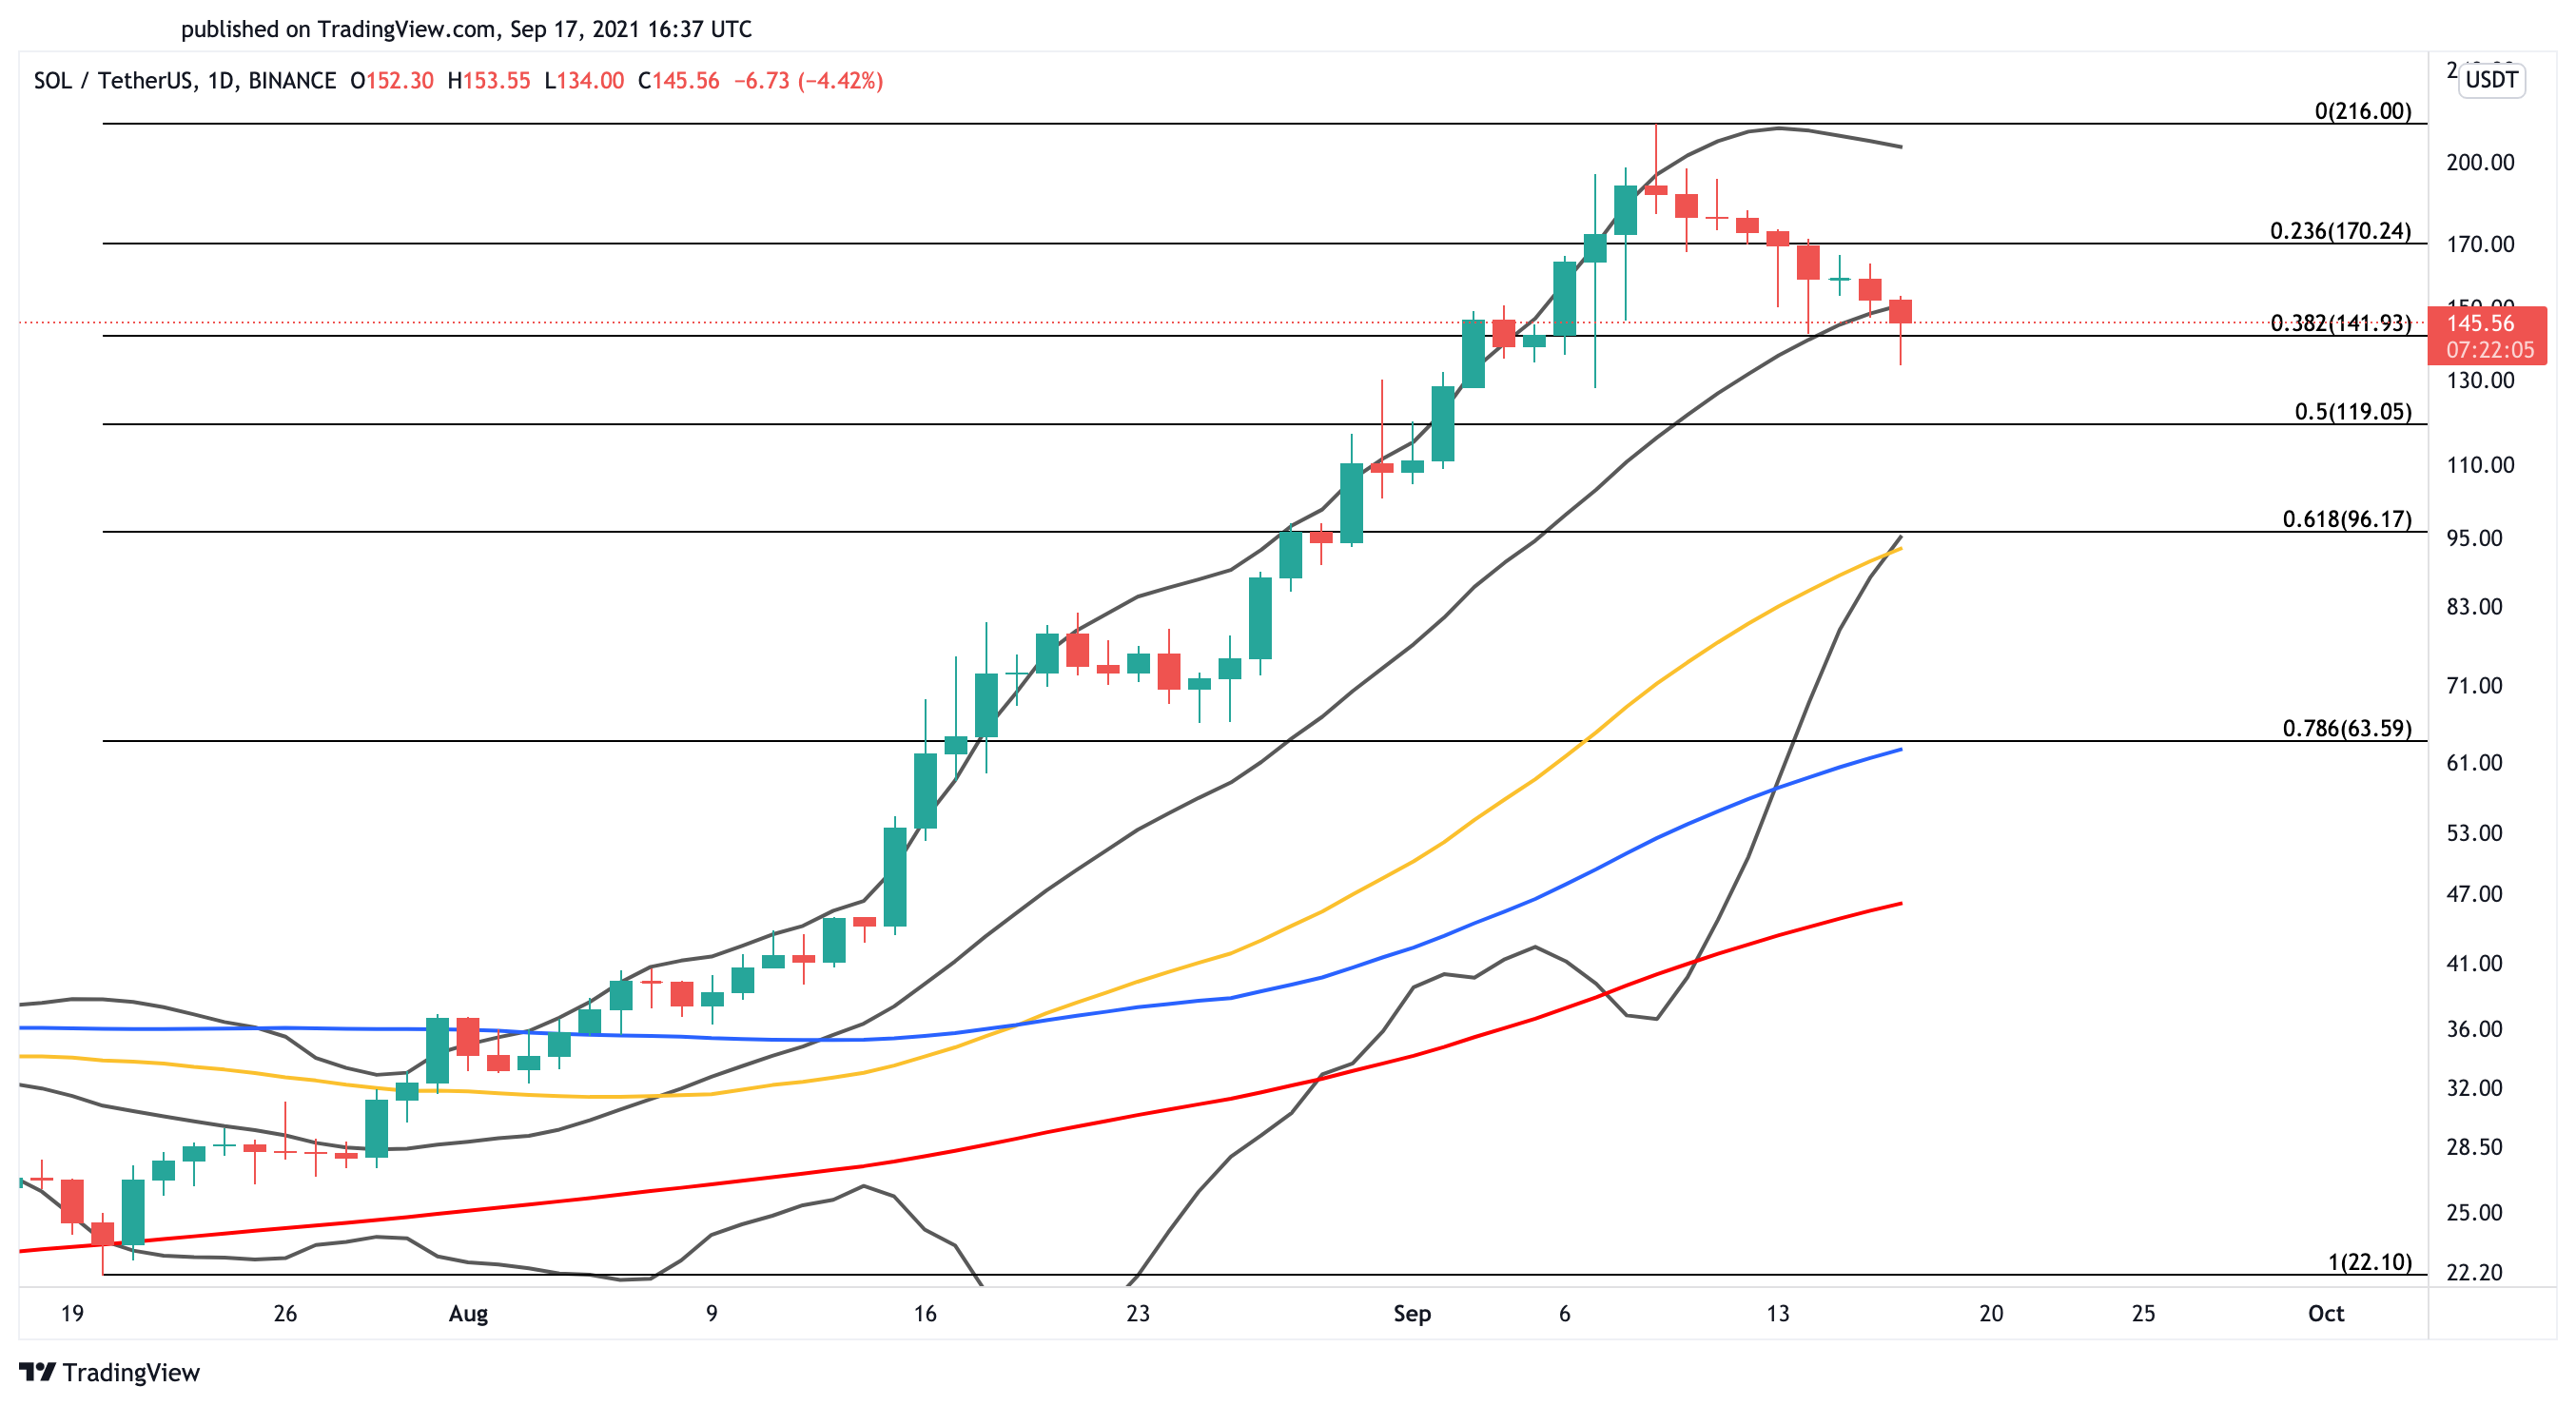
The high-throughput blockchain’s SOL token has enjoyed an impressive 877% bull run since Jul. 20. The so-called “Ethereum killer” has risen from a low of $22.10 to a new all-time high of $216, becoming the seventh-largest cryptocurrency by market cap.
Following the $216 peak of Sep. 9, traders have been having a tough time anticipating SOL’s price action. Since the peak, more than $250 million worth of long and short positions have been liquidated across the board, with over $27 million of the losses incurred in the past 24 hours.
One of the main reasons for such an erratic price action was the “intermittent instability” issue that the Solana network experienced on Sep. 14. A denial of service attack took the blockchain down for roughly 18 hours, generating panic among token holders. The sell-off pushed prices down by 17% within a few hours to a low of $142.60.
Holding on to Critical Support
Although Solana’s price has been fluctuating since the outage, it wasn’t until today that it reached a vital support level. The 38.2% Fibonacci retracement level and the middle Bollinger band on the daily chart seem to be acting as a strong foothold for SOL.
If this demand wall can hold, SOL could rebound towards the 23.6% Fibonacci retracement level at $170 or even the all-time high at $216.
Still, investors need to pay close attention to the $142 support level over the next few days. Slicing through this interest area might lead to a steeper correction toward the 50-day moving average and the 61.8% Fibonacci retracement level at $96.
The information on or accessed through this website is obtained from independent sources we believe to be accurate and reliable, but Decentral Media, Inc. makes no representation or warranty as to the timeliness, completeness, or accuracy of any information on or accessed through this website. Decentral Media, Inc. is not an investment advisor. We do not give personalized investment advice or other financial advice. The information on this website is subject to change without notice. Some or all of the information on this website may become outdated, or it may be or become incomplete or inaccurate. We may, but are not obligated to, update any outdated, incomplete, or inaccurate information.
You should never make an investment decision on an ICO, IEO, or other investment based on the information on this website, and you should never interpret or otherwise rely on any of the information on this website as investment advice. We strongly recommend that you consult a licensed investment advisor or other qualified financial professional if you are seeking investment advice on an ICO, IEO, or other investment. We do not accept compensation in any form for analyzing or reporting on any ICO, IEO, cryptocurrency, currency, tokenized sales, securities, or commodities.
See full terms and conditions.
Source: Read Full Article


