$53,000 or $43,000: Bitcoin Price Sets Sight On Two Crucial Pillars As Indicators Reflect BTC’s Energy

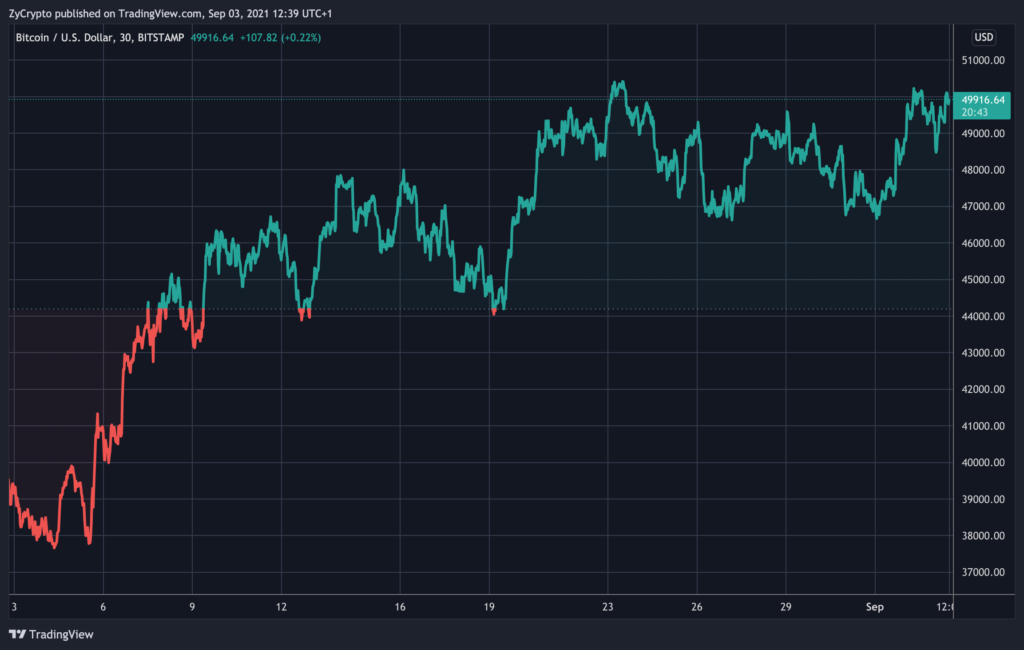
Bitcoin is currently striving to stay above $50,000. The standard cryptocurrency dropped after mildly correcting within the last 24hours. The big bull flirted with the $49k price level, hit a high of $50,282 before losing momentum. The way forward is divided, as analysts’ explain why the asset is either going to $53,000 or $43,000 in the long term.
Indicators show next stop for Bitcoin ; $53,000 or $43,000
The midday chart seems to be pointing to a tricky path for Bitcoin at this time. As observed by Analyst Adrian Zduńczyk in his Bitcoin report, It [the midday chart] has got as many bullish indications as potential retracement setups.”
Apparently, the market is split between bearish and bullish pressure. “On one hand, it has just seen the upwards trend breakdown.” He proceeds to say that the breakdown is a confirmation of the local signs of weakness and “trend getting wobbly”.
At the same time, the breakdown is also showing itself to be a failed one, seeing as the candlesticks from yesterday’s chart closed over the broken trend line, which is usually regarded as a swing failure.
It also appears that there are more weighty signals than there are bullish signals. Given the weight of the bearish signals against the bullish ones, the analyst is asserting that Bitcoin is a bit of a gamble to trade at the moment. Down the line, any incoming bullish news is expected to take prices to $53,000, while bearish news could sweep off $10,000 from the aforementioned price.
As for whether Bitcoin can stay above $49,000, his response as quoted below reads :
“The longer BTCUSD resists to push through and reclaim the supply zone 49.1-49.7k, the higher the chances are for bitcoin to revisit demand zone 46.6-47k and hence fail the “bull flag” pattern with a fake breakout on top once MA50 (orange average) is lost with ugly close below, back inside the flag pattern.”
Conclusively, he remains bullish on Bitcoin maintaining the $50,000 level once again. However, a drop below current price levels could also be the case in the future.
“It’s either 53k or 43k then. I’m quite positive that 53k is just a matter of time as 53-58k is where the daily volume profile records serious spikes. The question is, if it shoots there straight up from here or follows regular, technical and healthy retracement to reload the longs with a good risk/reward around 42-43k.”
Source: Read Full Article

