Bitcoin and Ether Market Update November 18, 2021

Total crypto market cap erased $282 billion from this value for the period since Monday and now stands at $2.59 trillion. The top ten coins were all in red for the last 24 hours with Solana (SOL) and Dogecoin (DOGE) being the worst performers with 4.2 and 2.9 percent of losses respectively. At the time of writing bitcoin (BTC) is trading at $59,400. Ether (ETH) is at $4,204.
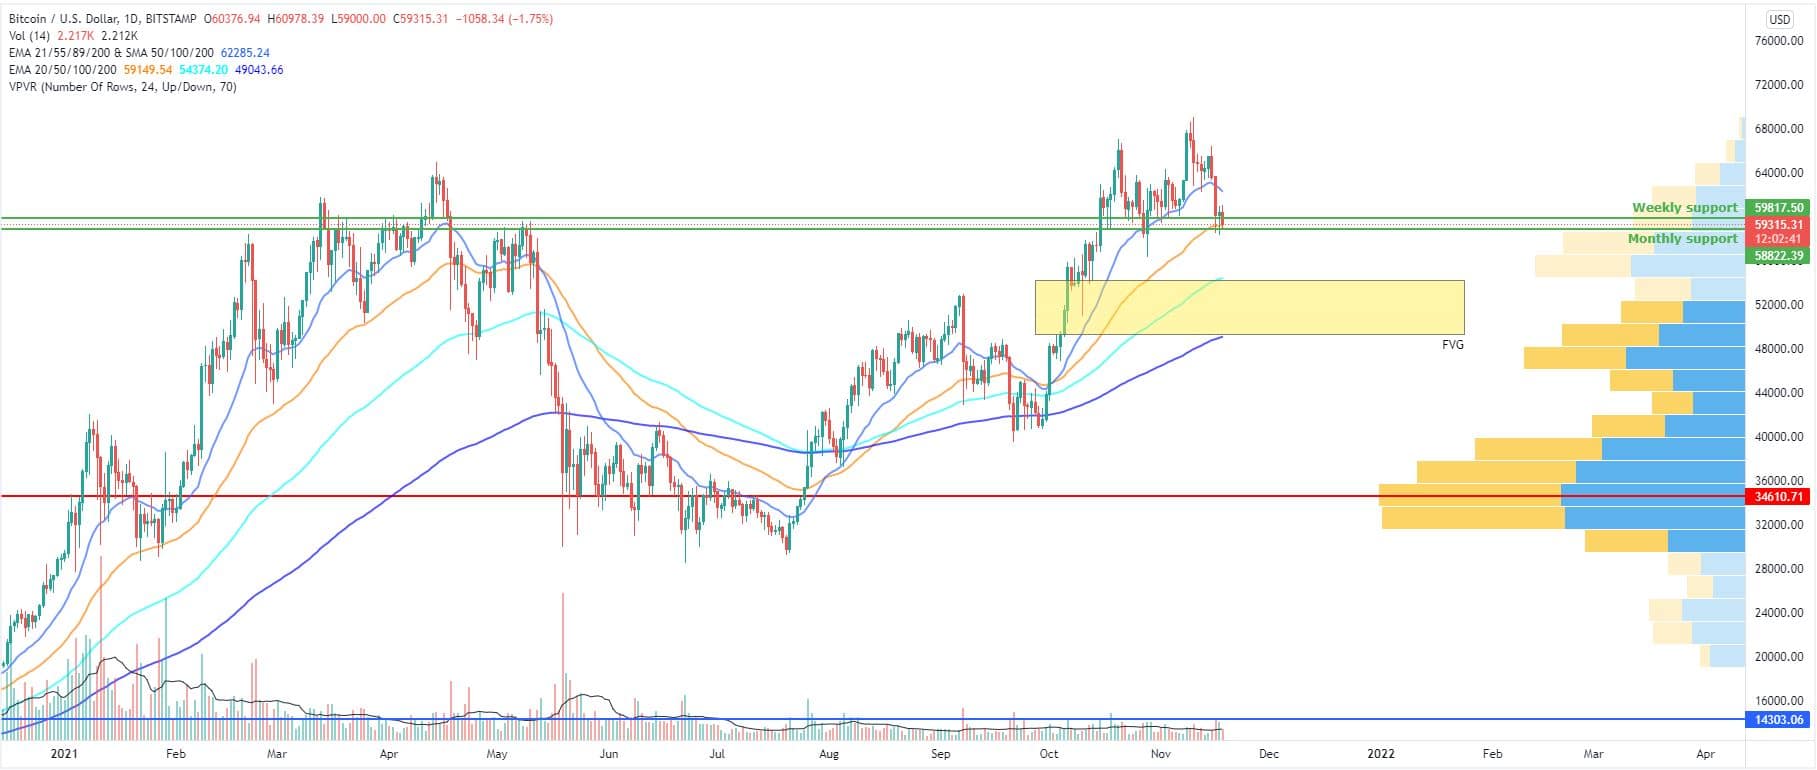
BTC/USD
Bitcoin closed the trading day on Sunday, November 14 at $65,526. It was its second session in green after a four-day period marked with high volatility and during which the biggest cryptocurrency erased 5.5 percent from its valuation. It could not extend the rally after peaking at $69,000 on November 10.

Still, BTC was 3.3 percent up on a weekly basis.
The new seven-day period started with a 3 percent drop to $63,500 on Monday. The price action was very much repeating the one from September 7 when BTC experienced a significant correction.
Bears pushed the price below the 21-day EMA on the daily timeframe on November 16 and managed to “steal” yet another 5.5 percent from it. The leading cryptocurrency fell as low as $58,700 during intraday and now traders were starting to look at the weekly support at $60,000 and the monthly one – at $58,900 to provide the needed stability.
The mid-week session on Wednesday brought yet another short-term low for BTC. It touched $58,375 but quickly recovered to the zone above $60,000 in the evening.
What we are seeing midday on Thursday is a fresh re-test on the 50-day EMA on the daily chart as BTC is once again moving South.
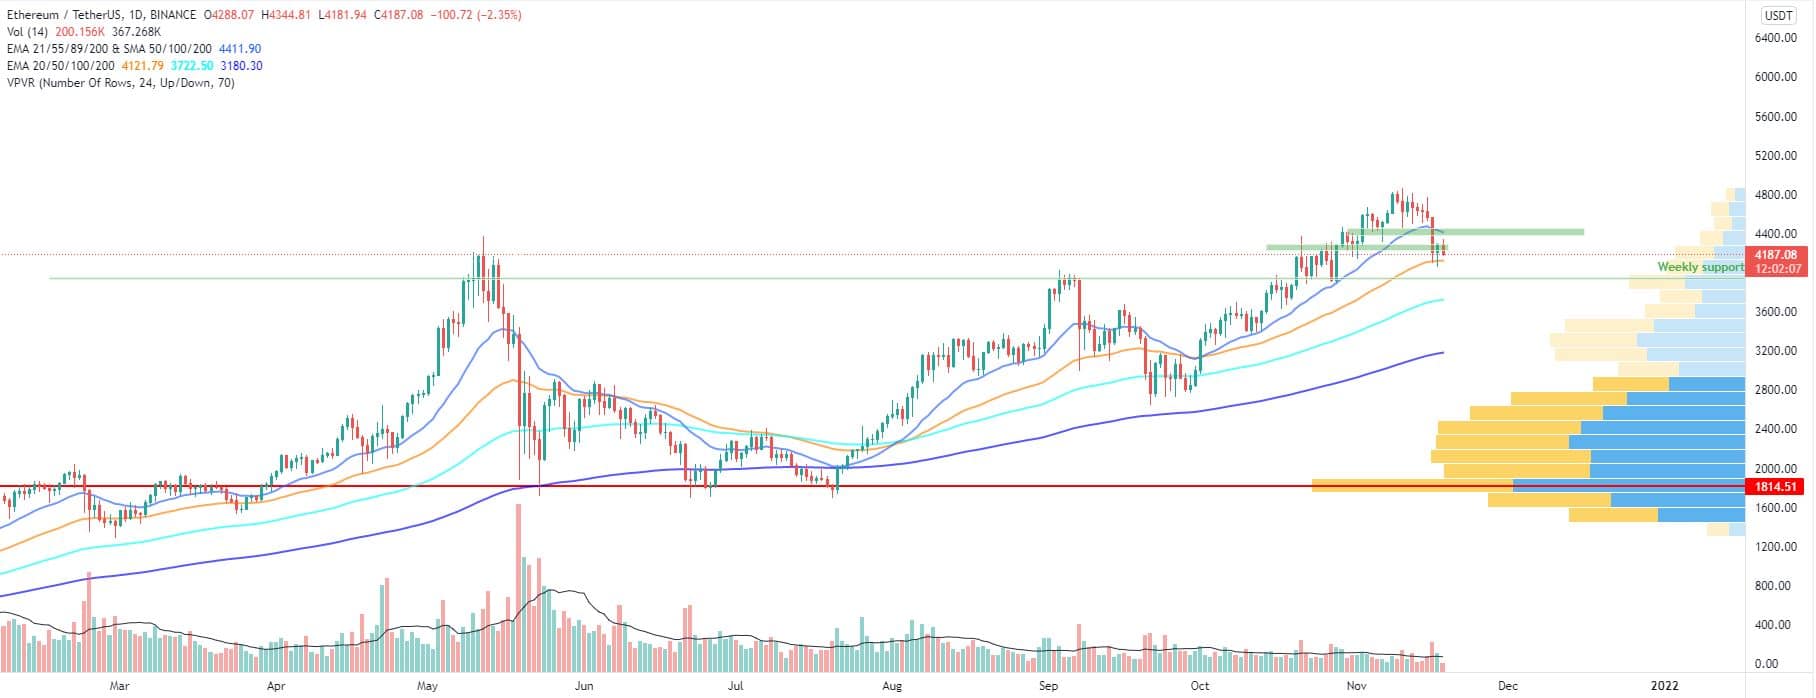
ETH/USD
The Ethereum Project token ETH closed the trading session on Sunday, November 14 at $4,621 on its third consecutive day in red and fifth since hitting an all-time high at $4,869 a few days earlier.
The ether was following closely the price movement of bitcoin and it was already showing signs of exhaustion. Many traders were using the opportunity to take profits and wait for a correction to re-enter the market.
The coin ended the seven-day period flat, but still above its last highest high.
On Monday, the ETH/USDT pair dropped down to $4,558 as the selloff continued. The daily chart of bitcoin was showing clear similarities to the trading patterns we had back in the February- May 2021 period with it making three consecutive higher highs followed by a significant correction.
The Tuesday session was no different and the coin moved further down to $4,204, breaking below the 21-day EMA. It found support at the 50-day EMA and the previous horizontal resistance area.
The mid-week trading day on Wednesday came with a new short-term low as ETH tested the $4,000 mark. Still, bulls managed to absorb the selling activity and the leading altcoin closed in green.
What we are seeing, midday on Thursday is the exact same candle on the daily chart, but in the opposite direction. Trading volumes are relatively low.
Related posts:
Source: Read Full Article