Bitcoin Cash Correcting Lower, May Slide to $430 Low

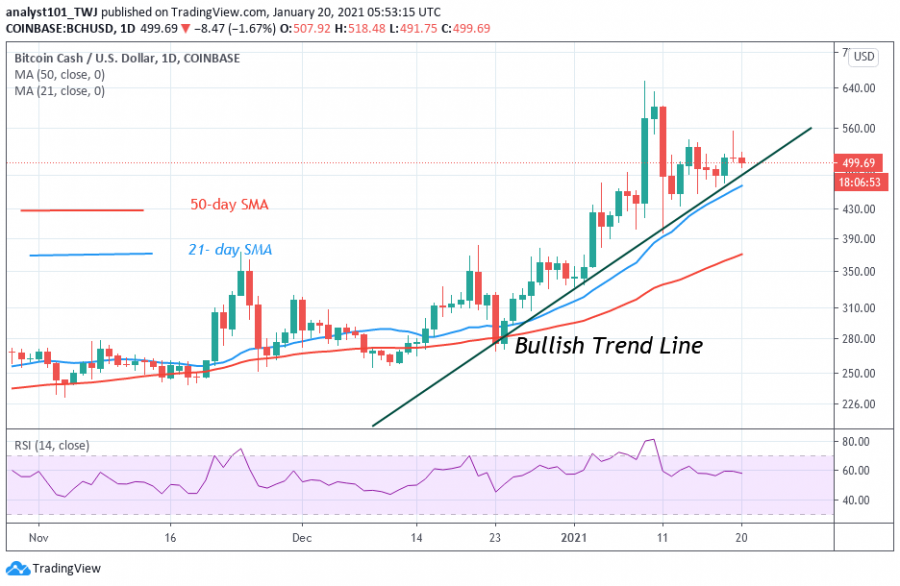
Following its recent downtrend on January 11, Bitcoin Cash is now trading below the $540 resistance level. In other words, BCH price fluctuates between $430 and $540.
Today, the crypto is falling to the lower price range. Each time price tests the $540 resistance; the coin will fall and resume a downward move to the lower price range. It appears the downtrend is ongoing and it is approaching the lower price range.

When BCH is range-bound, there is a tendency for the asset to encounter a breakout or breakdown. On the upside, if the price breaks the $540 resistance BCH will rally above $654 resistance. BCH will continue to rise to the next target price of $833. However, if the bears break the $430 support, the downtrend is likely to resume. The decline may extend to a $386 low
Bitcoin Cash indicator reading
The crypto price is falling and attempting to break the trend line. There is a likelihood of a change in the trend if price breaks and closes below the trend line. In the same vein, if price falls and breaks below the SMAs, the coin is likely to decline. On the other hand, BCH will continue to rise as long as the price is above the EMAs.
Key Resistance Zones: $560, $580, $600
Key Support Zones: $240, $220,$200
What is the next move for Bitcoin Cash?
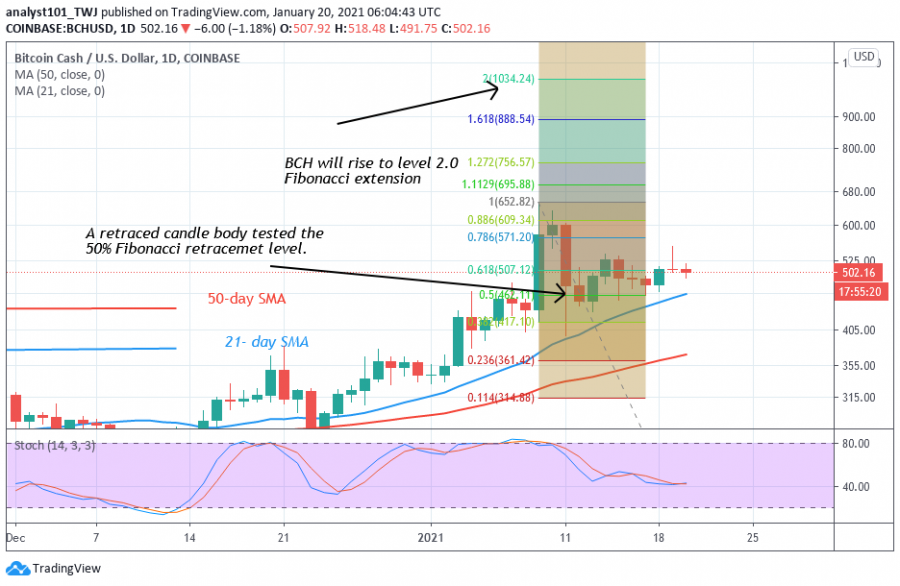
BCH upward move is likely if the bulls break the current resistance. Meanwhile, Fibonacci tool analysis will remain the same as price continues its fluctuation in the current range. On January 10 uptrend; the retraced candle body tested the 50% Fibonacci retracement level. The retracement indicates that BCH is likely to rise to level 2.0 Fibonacci extension. In other words, BCH will rise to a high of $1034.24.
Disclaimer. This analysis and forecast are the personal opinions of the author that are not a recommendation to buy or sell cryptocurrency and should not be viewed as an endorsement by Coin Idol. Readers should do their own research before investing funds.
Source: Read Full Article