Bitcoin Rebounds Above $54,000 Support, Revisits $60,000 High

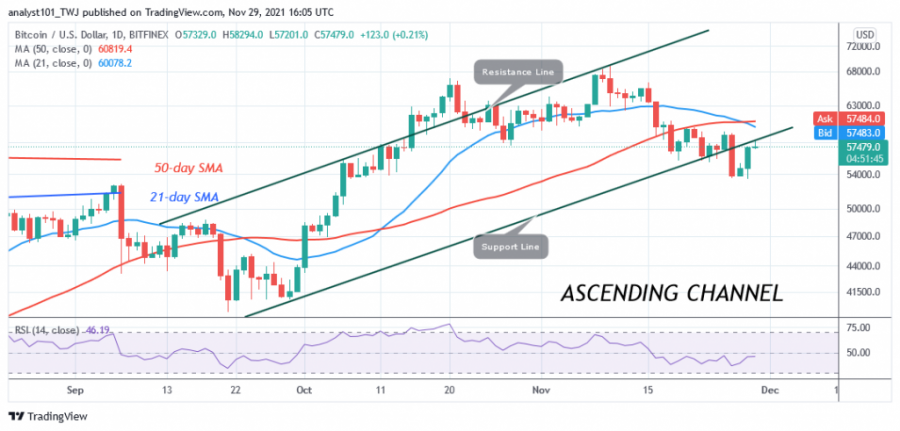
After the recent downward momentum, Bitcoin (BTC) has rallied back above the $54,000 support. On November 26, sellers pushed the price of BTC to the low of $53,555. Had the bearish momentum continued, the bitcoin price would have fallen to $51,050 or $50,000.
But on November 26, it went down. The bulls bought the dips and catapulted Bitcoin back up. Today, Bitcoin is trading at $57,569 as of press time. BTC/USD has fallen to its previous range of $55,700 to $58,000. If buyers keep BTC prices above the $58,000 resistance, the cryptocurrency will come out of the downward correction. At the same time, buyers have the advantage of regaining the previous highs of $60,000 and $64,000.
Bitcoin indicator reading

On November 26, Bitcoin recorded a bearish crossover. That is, the 21-day line crossed below the 50-day moving average, which is a sell signal. Bitcoin is at level 46 on the Relative Strength Index for period 14, and the cryptocurrency price is below the moving averages, indicating a downtrend. Bitcoin is now in bullish momentum above the 25% area of the daily stochastic.
Technical indicators:
Major Resistance Levels – $65,000 and $70,000
Major Support Levels – $60,000 and $55,000
What is the next direction for BTC?
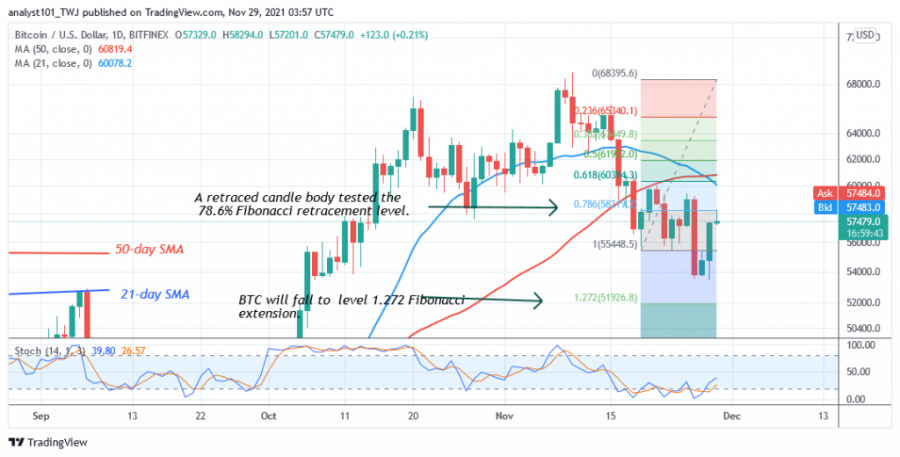
On the 4-hour chart, the price of BTC has been in a downtrend. The cryptocurrency is returning above the $54,000 support. Meanwhile, the downtrend from November 18 has shown a candlestick testing the 78.6% Fibonacci retracement level. The retracement suggests that the BTC price will fall but reverse at the 1.272 Fibonacci extension level or $51,926.
Disclaimer. This analysis and forecast are the personal opinions of the author and are not a recommendation to buy or sell cryptocurrency and should not be viewed as an endorsement by CoinIdol. Readers should do their own research before investing funds.
Source: Read Full Article