BTC/USD Bulls Find Relief at 38562 Support: Sally Ho’s Technical Analysis 10 January 2021 BTC
Bitcoin (BTC/USD) reclaimed some lost ground early in today’s North American session as the pair appreciated to the 40150.84 area after trading as low as the 38582.00 area during the European session, a test of the 61.8% retracement of the recent appreciating range from 36565.08 to 41794.95. Traders took BTC/USD as high as the 41452.12 level during the Asian session before selling pressure began, intensifying around the 78.6% retracement of the recent depreciating range from 41794.95 to 38700. The pair has established a succession of new lifetime highs, with the latest around the 41986.37 area. Stops were recently elected above a series of additional upside price objectives during the move higher, including the 40517.80, 40667.76, 40991.44, 41200, 41267.10, 41489.74 levels. Stops were recently elected above the 35943.73, 36480.83, and 36854.45 areas as well, upside price objectives related to previous buying pressure around the 17580, 16200, and 9819.83 levels.
Prior to that, Stops were also elected above some other upside price objectives including 34446.27, 34603.65, and 34697.35, levels that are technically significant due to previous buying activity that also originated around the 17580, 21913.84, and 16200 areas. Additional upside price objectives include the 42309.01, 42701.91, 42803.53, 43447.48, and 43617.07 levels. Following the pair’s recent moves to successive all-time highs, downside retracement levels and areas of potential technical support include the 38159.91, 37249.25, 36226.47, 35454.75, and 33879.46 levels. BTC/USD traded up more than 44% in January, and closed 2020 with a gain of approximately 292%. Traders are observing that the 50-bar MA (4-hourly) is bullishly indicating above the 100-bar MA (4-hourly) and above the 200-bar MA (4-hourly). Also, the 50-bar MA (hourly) is bullishly indicating above the 100-bar MA (hourly) and above the 200-bar MA (hourly).

Price activity is nearest the 50-bar MA (4-hourly) at 37007.61 and the 50-bar MA (Hourly) at 40500.15.
Technical Support is expected around 33638.11/ 33121.14/ 32164.09 with Stops expected below.
Technical Resistance is expected around 42309.01/ 42701.91/ 42803.53 with Stops expected above.
On 4-Hourly chart, SlowK is Bearishly below SlowD while MACD is Bearishly below MACDAverage.
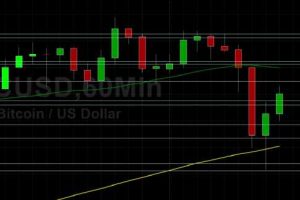
On 60-minute chart, SlowK is Bullishly above SlowD while MACD is Bearishly below MACDAverage.
Disclaimer: This trading analysis is provided by a third party, and for informational purposes only. It does not reflect the views of Crypto Daily, nor is it intended to be used as legal, tax, investment, or financial advice.
Related TAGS:
You can share this post!
Source: Read Full Article