Cardano's Trading Volume Hits Promising Levels — Could A Mega Rally Be Forming?

Cardano’s (ADA) is one of the few altcoins to watch out for this weekend. In the month of March, ADA is slowly attempting to prove that it is one of the most promising alternative crypto assets in the top-10 category.
ADA has recently recorded a significant surge in daily trading volume, leading to speculations that the altcoin is most likely on its way to the moon. Cardano saw trading volume surge past a whopping 23 billion ADA on the 7th of March.
Around the same time, ADA’s market cap was holding up quite strong after shedding some significant gains in the past weeks. For most of February, ADA’s market cap value was comfortably above $13 billion and sometimes tapped $14 billion for a short period of time. After slumping below $12 billion, the market cap seems also to be recovering. After securing and losing over $400 million in added value on March 7th, the market cap is already replacing losses.
ADA’s technical chart reveals buyers are in control of prices
On the other hand, the price of ADA still reflects the bear market that intensified last week and the week before. Recall the altcoins entered 2023 on a notably bullish note. A mild altcoin rally was even recorded in January and for a short period in February.
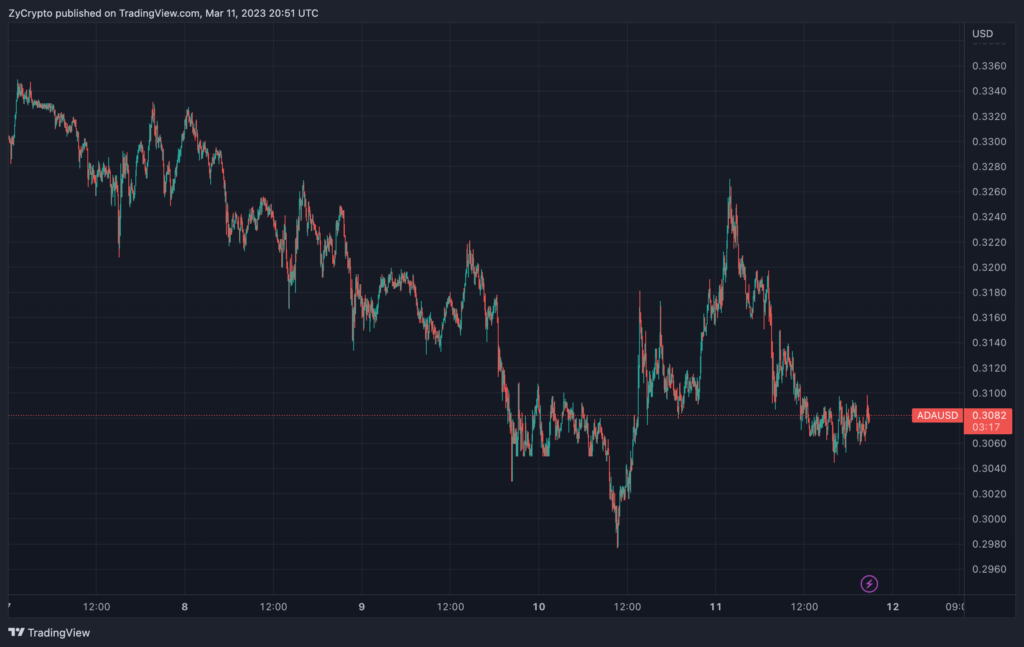
ADA hit a new high in January when its price value reached $0.39. February would push the asset even further to $0.41 before the bearish tragedy would impact prices and cause it to lose 22% of its price value in the space of 2 weeks. At the time of this report, ADA is down over 3% in the last 24 hours and over 8% in the last 7 days. With trading volume rising despite downward price movement, it will be no surprise if ADA bulls move upwards in the coming days.
It is also worth noting that ADA shows positive signs on the daily trading chart. Dan Gambardello, a well-known crypto trader, shared a chart showing ADA’s performance in the last 6 hours.
As shown on the chart, ADA has successfully pushed past the strong bearish pressure in the last fees hours. The last two green candles indicate a rather bullish pattern, displaying a weak price rejection, indicating that strong buyers control the price.
Source: Read Full Article

