Chainlink Price Declines Significantly As It Faces Rejection
Chainlink (LINK) price has been moving in the bullish trend zone since September 23.
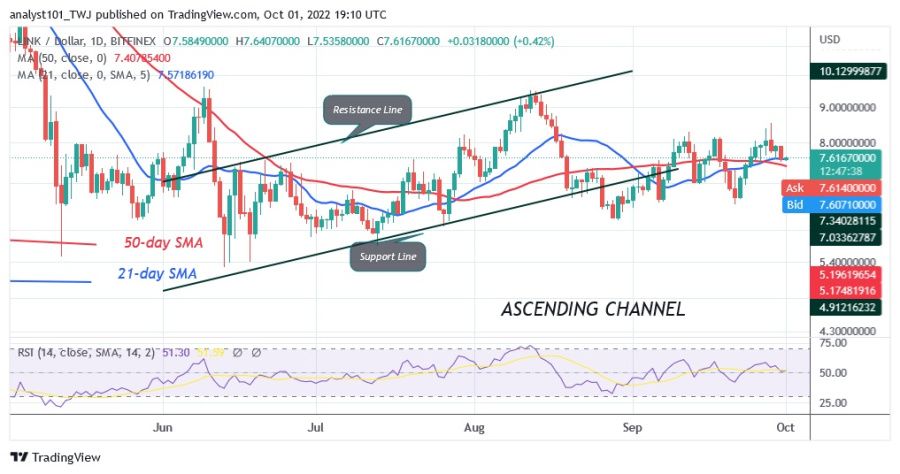
Chainlink (LINK) price long-term analysis: bullish
Sellers are trying to push Chainlink below the moving average lines. On September 28, buyers tried to reach the overriding resistance of $9.50 again, but were rejected at the recent high. The cryptocurrency is bearish as sellers push the price of LINK below the moving average lines. The selling pressure will intensify if the price breaks below the moving average lines. That is, the market will fall back to the previous low at $6.50. Nonetheless, at the time of writing, Chainlink is trading at $7.55.
Chainlink (LINK) Indicator Reading

Chainlink has fallen to level 49 on the Relative Strength Index for the 14 period. This explains that supply and demand have reached equilibrium. The price of the cryptocurrency is falling, but it is above the moving average lines. If it stays above these lines, it will be forced to move within a certain range.
The cryptocurrency has reached the oversold area as it has fallen below the 20% area of the daily stochastic. The 21-day line SMA and the 50-day line SMA are sloping downwards and describe the downtrend.
Technical Indicators
Key resistance zones: $10, $12, $14
Key support zones: $9, $7, $5
What is the next move for Chainlink (LINK)?
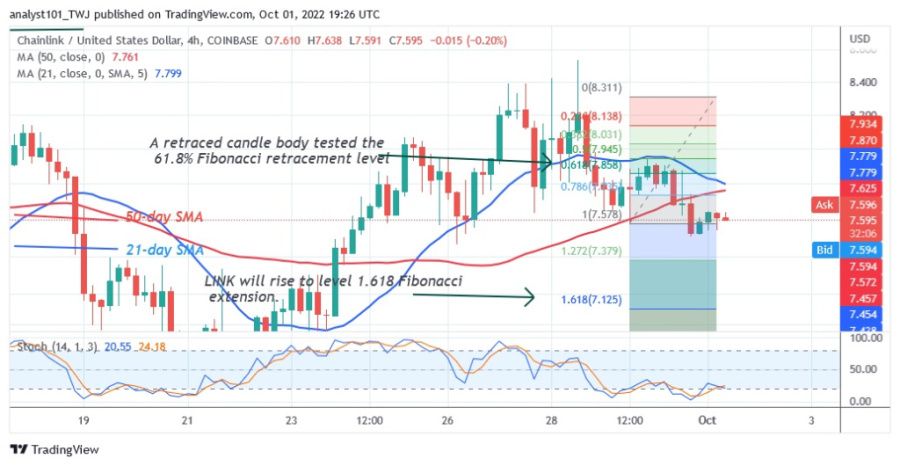
Currently, Chainlink is bearish due to the rejection of the high at $8.54. Selling pressure has resumed as the price breaks current support. On the price break down on September 29, a retraced candle tested the 61.8% Fibonacci retracement level. The retracement suggests that LINK will fall to the Fibonacci extension level of $1.618 or $7.12.
Disclaimer. This analysis and forecast are the personal opinions of the author and are not a recommendation to buy or sell cryptocurrency and should not be viewed as an endorsement by Coin Idol. Readers should do their own research before investing in funds.
Source: Read Full Article