Dogecoin Attempts To Recover To $0.07 As Demand And Supply Reach Equilibrium

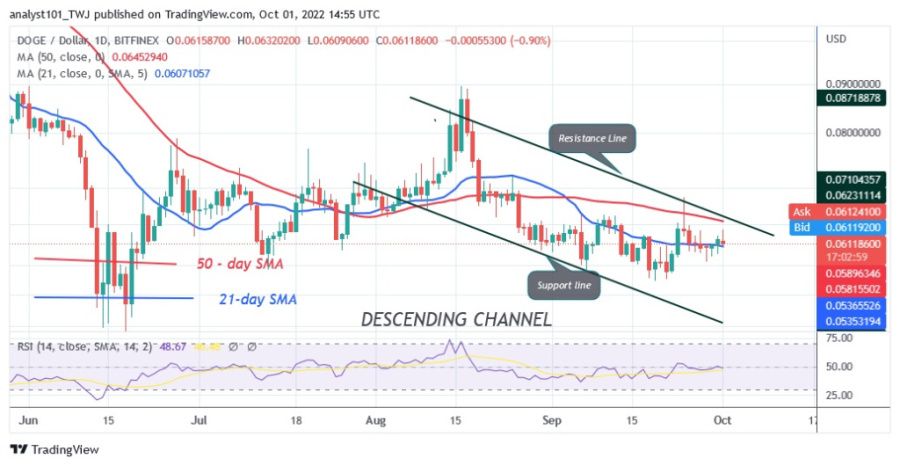
Dogecoin (DOGE) price is in a downtrend as the altcoin drops below the moving average lines.
Dogecoin (DOGE) Price Long Term Forecast: Bearish
On September 24, the price of DOGE broke above the 50-day line SMA and the 21-day line SMA. The upward momentum was pushed back at a high of $0.068. The cryptocurrency fell sharply below the moving average lines and reached the low of $0.057.

The cryptocurrency is currently trading between $0.057 and $0.066. Today, the price of DOGE is rising above the 21-day line SMA and trying to reach the recent highs. However, selling pressure may resume if DOGE deviates from the moving average lines. A break below $0.057 support would send the altcoin back to the previous low at $049. Meanwhile, DOGE is trading at $0.061 at the time of writing.
Dogecoin (DOGE) Indicator Reading
DOGE is at level 49 on the Relative Strength Index for period 14. RSI indicates that there is a balance between supply and demand. DOGE is trading between the moving average lines and may be back in a range. The market is in a bearish momentum as it is below the 80% area of the daily stochastic. The 21-day line SMA and the 50-day line SMA are sloping south, indicating a downtrend.
Technical Indicators:
Key resistance levels – $0.08 and $0.10
Key support levels – $0.07 and $0.05
What is the next direction for Dogecoin (DOGE)?
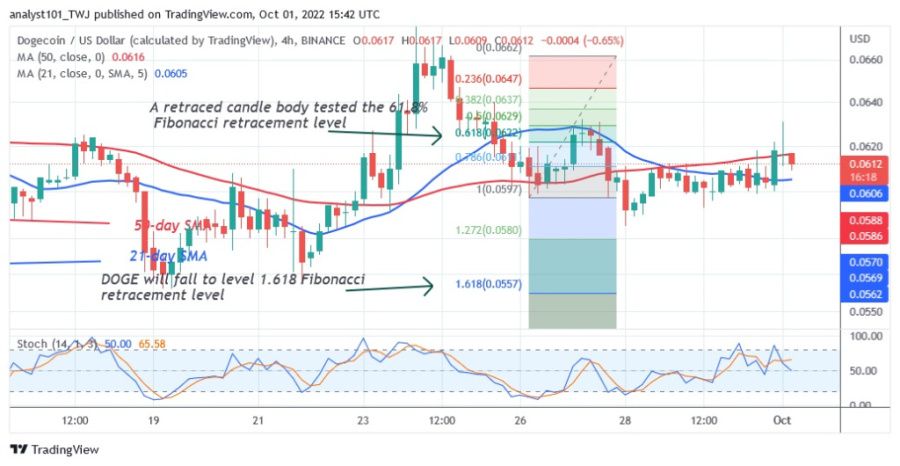
Dogecoin will likely continue to fall as it turns away from its recent high. On September 26, a bearish candlestick tested the 61.8% Fibonacci retracement level. The retracement suggests that DOGE will fall to the 1.618 Fibonacci extension level or the $0.055 level.
Disclaimer. This analysis and forecast are the personal opinions of the author and are not a recommendation to buy or sell cryptocurrency and should not be viewed as an endorsement by Coin Idol. Readers should do their own research before investing in funds.
Source: Read Full Article