Ripple Faces Stiff Resistance at $1.70 High as Bears Attempt to Sink XRP to $1.00 Low

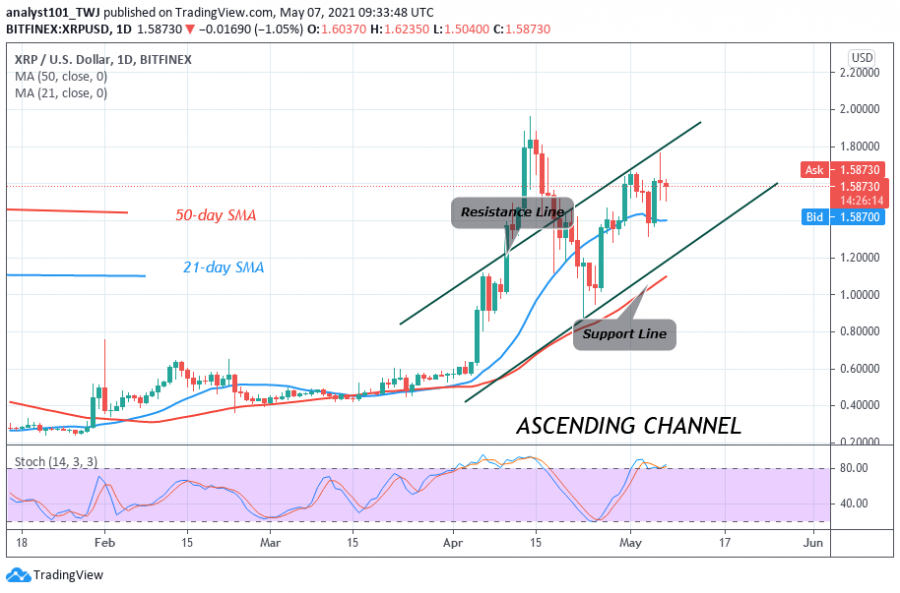
Since May 1, Ripple’s upward move has been facing stiff resistance at the $1.70 resistance zone. Today, XRP is declining after its rejection from the resistance zone. This may cause the altcoin to decline.
On May 1, the altcoin was rejected and XRP fell and found support above the 21-day SMA. This propels the altcoin to resume an upward move. On the upside, if the bulls break the $1.70 resistance, the altcoin will rise to retest or break the $1.96 overhead resistance.
Nonetheless, if buyers breach the overhead resistance, Ripple will resume the second round of upside momentum. The market is expected to rally to the high of $4.00. Presently, the altcoin is retracing after the rejection from the recent high. If the price retraces and breaks below the 21-day SMA, the altcoin will decline to $1.0 low. Ripple is trading at $1.58 at the time of writing.
Ripple indicator analysis
Ripple is above 80% range of the daily stochastic. It indicates that the market has reached the overbought region. Sellers have already emerged to push prices down. XRP price is above the 21-day and 50-day SMAs which indicates a further movement of prices.
Technical indicators:
Major Resistance Levels – $1.95 and $2.0
Major Support Levels – $0.60 and $0.55
What is the next move for Ripple?
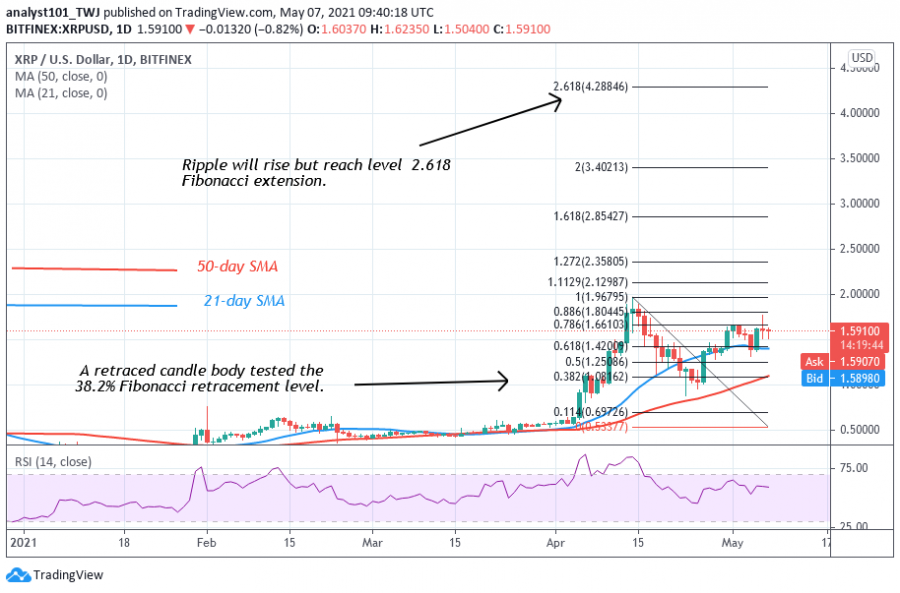
Ripple is fluctuating near the current resistance level. The market will move up once the initial resistance is breached. Meanwhile, on April 14 uptrend; a retraced candle body tested the 38.2% Fibonacci retracement level. The retracement indicates that Ripple is likely to rise to level 2.618 Fibonacci extension or the high of $4.28.
Disclaimer. This analysis and forecast are the author’s personal opinions and not a recommendation to buy or sell cryptocurrency and should not be viewed as an endorsement by CoinIdol. Readers should do their own research before investing
Source: Read Full Article


