Ripple May Further Decline as Bears Beak $1.10 Support

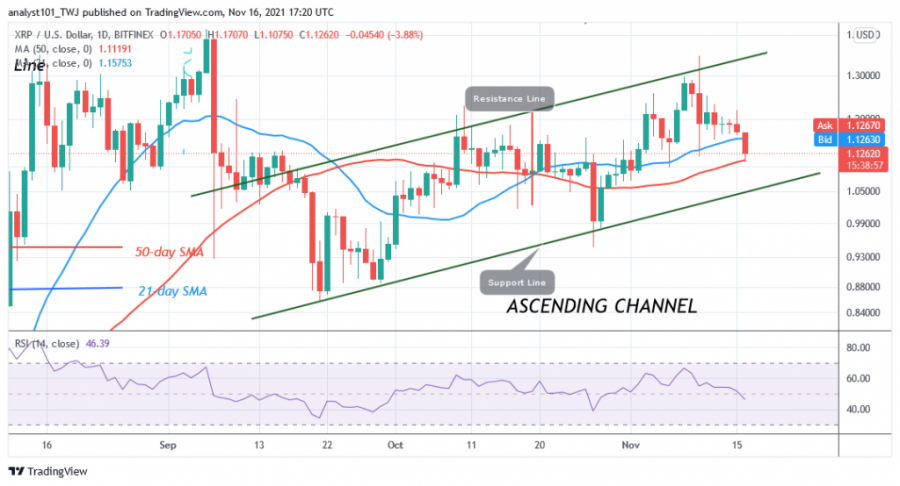
Ripple (XRP) has been steadily falling as the price drops below the 21-day moving average but holds above the 50-day moving average. Once the 50-day moving average is broken, the downtrend will resume.
The XRP price could have an accelerated downtrend. If Ripple falls, it could hit a low of $0.94. On the other hand, if the support of the 50-day moving average line holds, XRP/USD will start a new upward movement. This also means that the buyers have overwhelmed the sellers. The bulls will push the XRP price to break through the $1 and $1.24 resistance levels. The bullish momentum will also extend to the previous high of $1.41.
Ripple indicator analysis

Ripple is at level 45 on the Relative Strength Index for period 14. The altcoin has fallen into the downtrend zone, suggesting that it is vulnerable to further downside. The XRP price is on the verge of falling below the moving averages, which will lead to further selling. The altcoin has also fallen below the 20% range of the daily stochastic. This means that selling pressure has reached bearish exhaustion. The cryptocurrency will soon start trending upwards again.
Technical indicators:
Major Resistance Levels – $1.95 and $2.0
Major Support Levels – $0.80 and $0.60
What is the next move for Ripple?
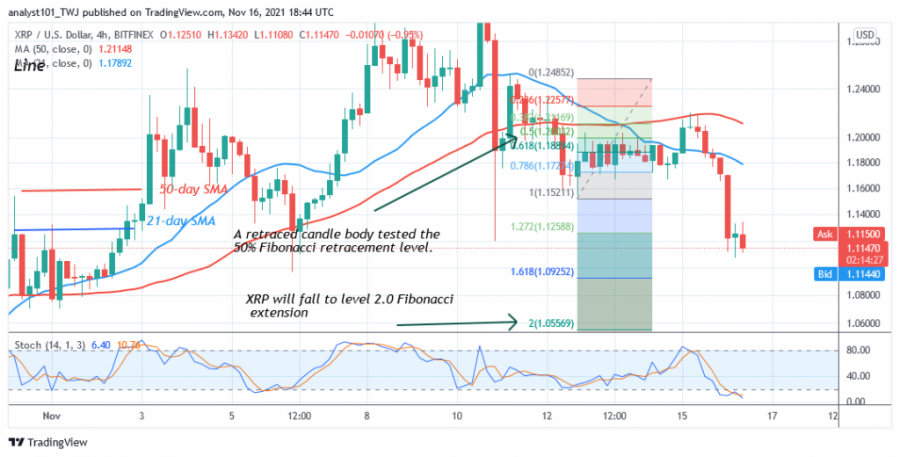
On the 4-hour chart, XRP is in a downtrend as the price has fallen below the moving averages. The Fibonacci tool is pointing to further downward price movement. Meanwhile, the downtrend from November 12 has shown a candlestick testing the 50% Fibonacci retracement level. The retracement suggests that XRP price will fall to the 2.0 Fibonacci extension level or $1.05.
Disclaimer. This analysis and forecast are the personal opinions of the author are not a recommendation to buy or sell cryptocurrency and should not be viewed as an endorsement by CoinIdol. Readers should do their own research before investing.
Source: Read Full Article