TA: Bitcoin Faces Another Rejection, Here’s What Could Trigger Nasty Decline

Bitcoin price climbed above the $38,000 resistance against the US Dollar, but it failed near $39,500. BTC is correcting lower and it might dive if it breaks the $37,000 support.
- Bitcoin failed to gain momentum for a break above $39,500 and $40,000.
- The price is currently trading above $37,000 and the 100 hourly simple moving average.
- There is a major rising channel forming with support near $37,400 on the hourly chart of the BTC/USD pair (data feed from Kraken).
- The pair must stay above $37,000 and the 100 hourly SMA to avoid a major decline.
Bitcoin Price Trims Gains
Bitcoin started a decent increase above the $37,500 resistance zone. BTC even broke the $38,000 resistance level and settled well above the 100 hourly simple moving average.

The bulls gained strength for a push above the $39,000 level. However, they struggled to a move towards the $40,000 level. The price topped near the $39,500 level and it recently started a fresh decline. There was a break below the $38,500 and $38,000 levels.


Bitcoin traded below the 50% Fib retracement level of the upward move from the $35,925 swing low to $39,500 high. It is currently trading above $37,000 and the 100 hourly simple moving average.
An immediate support on the downside is near the $37,500 level. There is also a major rising channel forming with support near $37,400 on the hourly chart of the BTC/USD pair. The channel support is close to the 61.8% Fib retracement level of the upward move from the $35,925 swing low to $39,500 high.
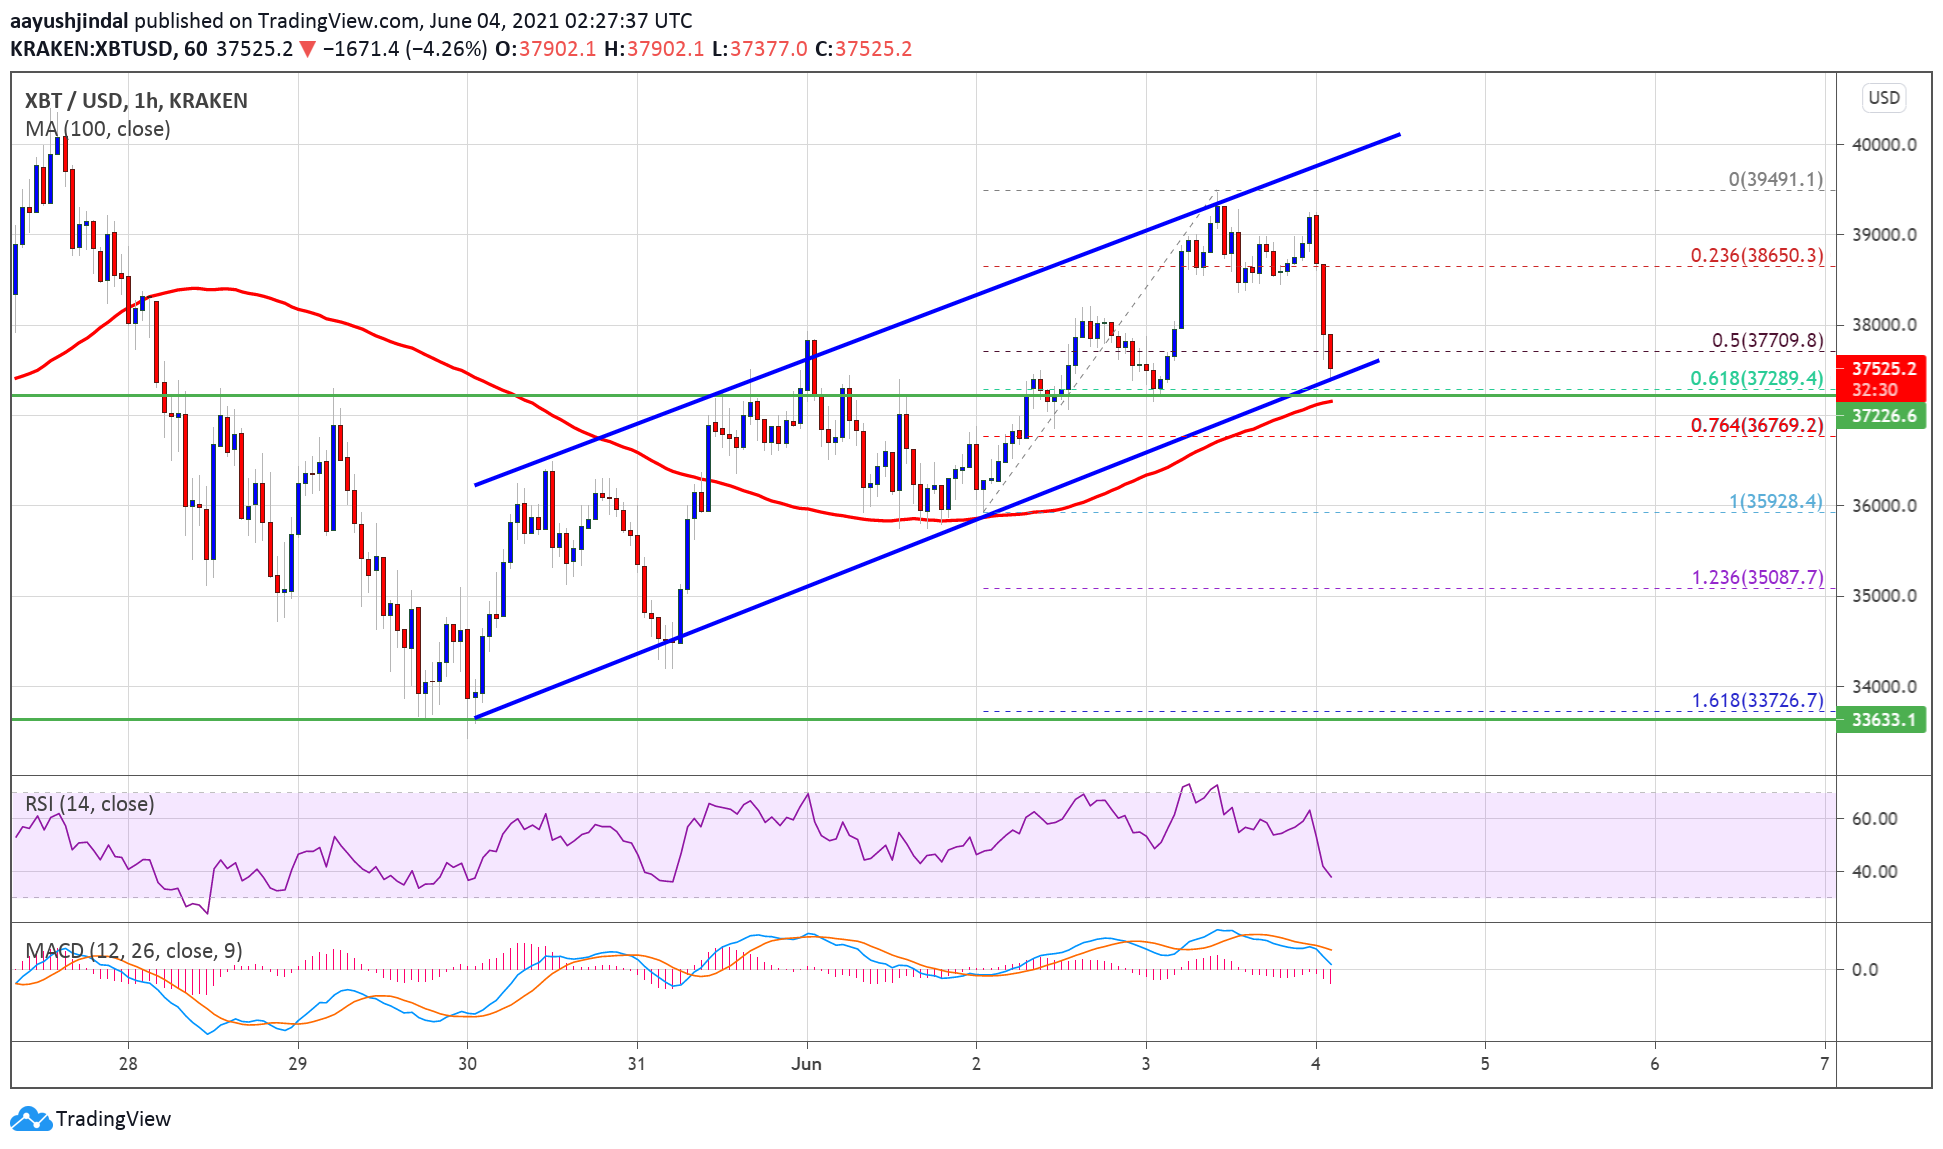
Source: BTCUSD on TradingView.com
On the upside, an immediate resistance is near the $38,200 level. The first major resistance is near the $39,500 level. The main resistance is still near the $40,000 zone. A clear break above the $40,000 level could set the pace for a larger increase.
Downside Break in BTC?
If bitcoin fails to clear the $38,500 resistance, it could extend its decline. An initial support on the downside is near the $37,500 level.
The first major support is near the $37,200 level and the 100 hourly simple moving average. If there is a downside break below the $37,200 support and $37,000, the price could start a sharp decline towards $35,000.
Technical indicators:
Hourly MACD – The MACD is now gaining pace in the bearish zone.
Hourly RSI (Relative Strength Index) – The RSI for BTC/USD is now below the 50 level.
Major Support Levels – $37,200, followed by $37,000.
Major Resistance Levels – $38,500, $39,500 and $40,000.
Source: Read Full Article