TA: Ethereum (ETH) Tumbles, Why Key Indicators Suggest More Pain

Ethereum declined below the main $2,000 support zone against the US Dollar. ETH price is showing bearish signs and it remains at a risk of more downsides below $1,800.
- Ethereum extended its decline below the $2,000 and $1,920 levels.
- The price is now trading well below the $2,000 resistance and the 100 hourly simple moving average.
- There is a key bearish trend line forming with resistance near $1,940 on the hourly chart of ETH/USD (data feed via Kraken).
- The pair is likely to continue lower below the $1,850 and $1,820 support levels.
Ethereum Price Dives 8%
There was no major recovery in ethereum above the $2,100 level, similar to bitcoin. As a result, ETH saw another decline and it broke the main $2,000 support zone.

The price gained pace below the $1,950 support and it settled well below the 100 hourly simple moving average. A low is formed near $1,864 and the price is now consolidating losses. An initial resistance on the upside is near the $1,910 level.

The 23.6% Fib retracement level of the recent drop from the $2,046 high to $1,864 low is also near $1,910. Besides, there is a key bearish trend line forming with resistance near $1,940 on the hourly chart of ETH/USD.
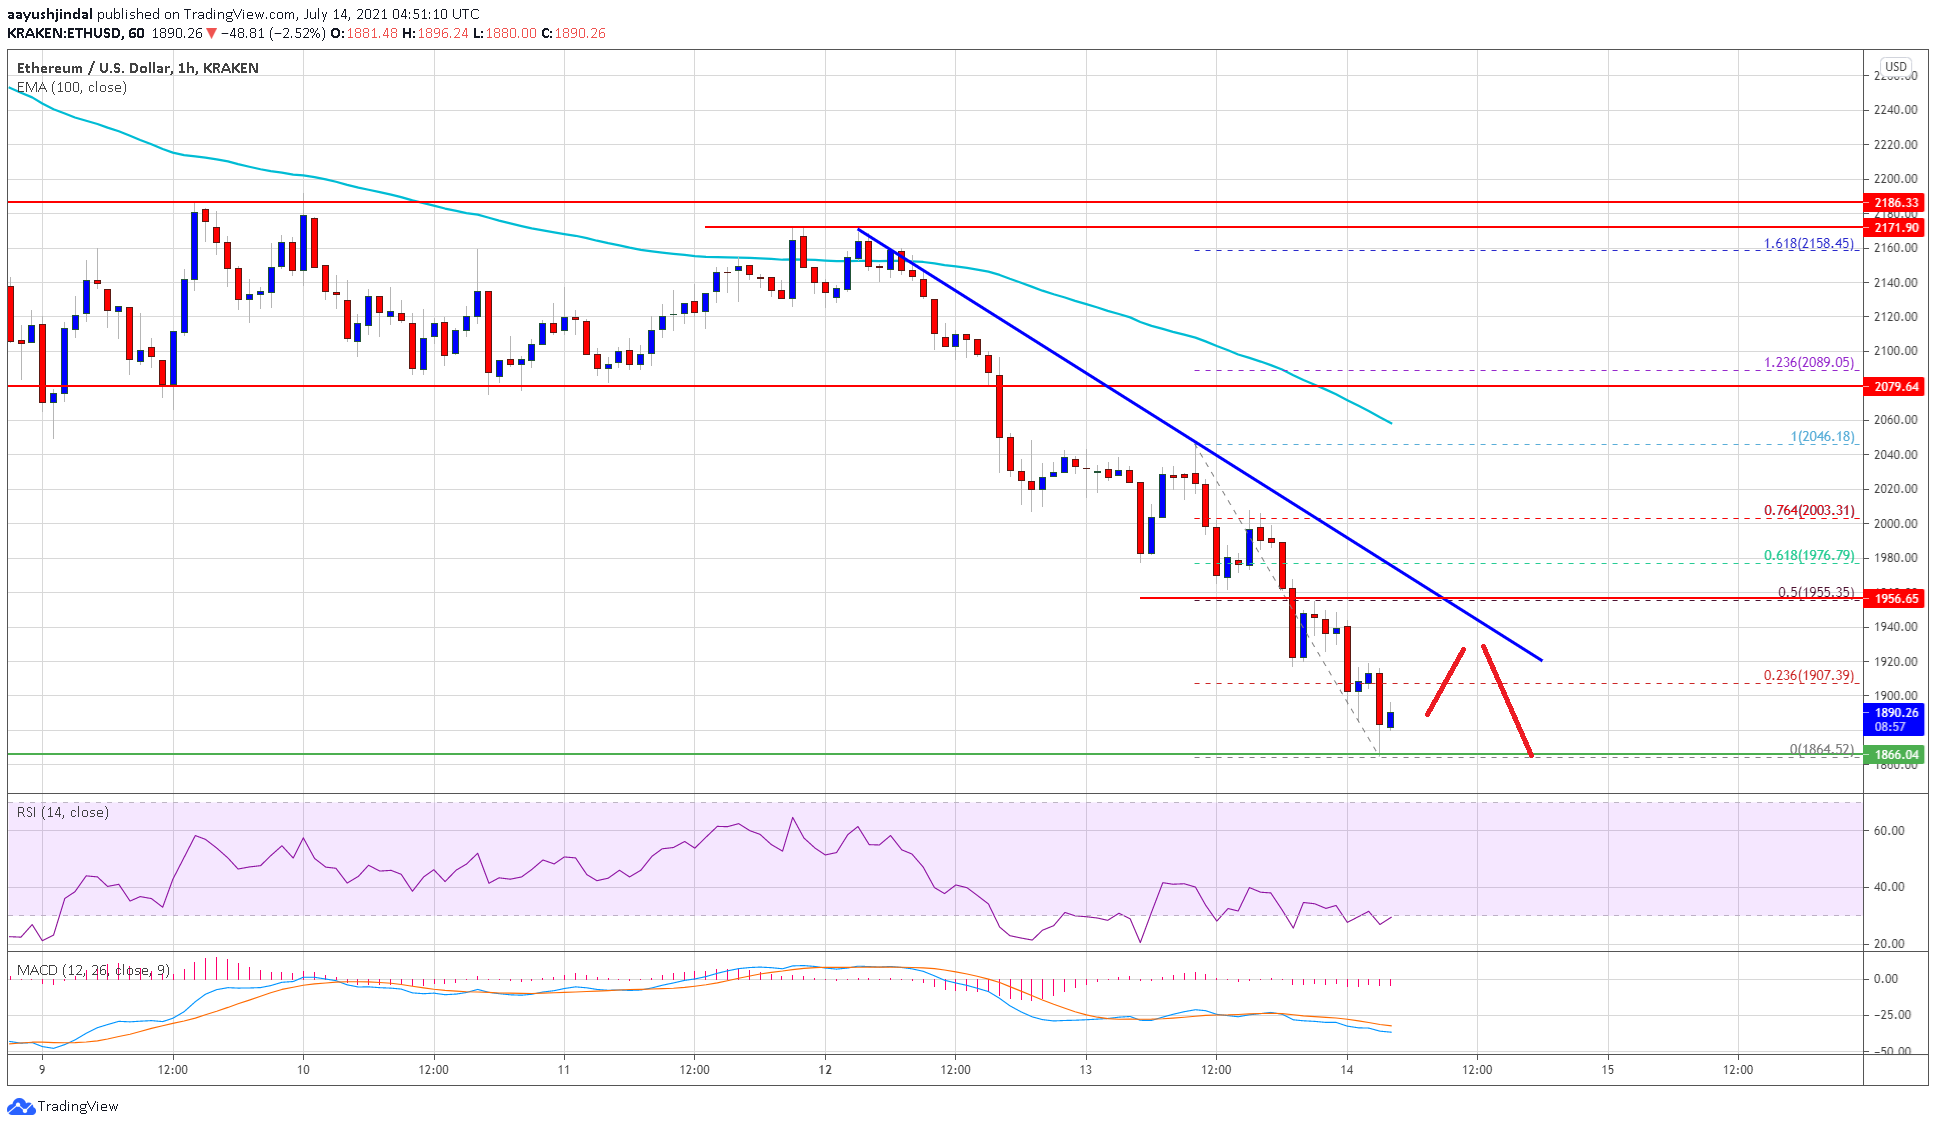
Source: ETHUSD on TradingView.com
The trend line resistance is close to the 50% Fib retracement level of the recent drop from the $2,046 high to $1,864 low. The main resistance now sits near the $2,000 level. A close above the $2,000 zone could set the pace for a larger increase in the near term. The next major resistance is near the $2,075 level.
More Losses in ETH?
If Ethereum fails to recover above $1,910 and $1,950, it could continue to move down. An initial support on the downside is near the $1,850 level.
A downside break below the $1,850 support could spark more losses. The first major support is near the $1,800 level. If ether fails to stay above the $1,800 support, it could decline towards the $1,750 swing support. Any more losses may possibly lead the price towards the $1,680 support zone in the coming sessions.
Technical Indicators
Hourly MACD – The MACD for ETH/USD is slowly gaining pace in the bearish zone.
Hourly RSI – The RSI for ETH/USD is now well below the 50 level.
Major Support Level – $1,850
Major Resistance Level – $2,000
Source: Read Full Article