ETH/USD Hits Major Stops Below 1294 During Rout: Sally Ho’s Technical Analysis 21 January 2021 ETH
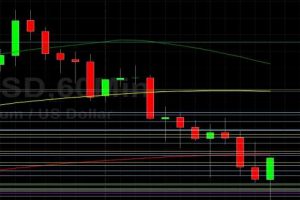
Ethereum (ETH/USD) extended its recent sell-off early in today’s North American session as the pair depreciated to the 1191.88 area after trading as high as the 1390.00 area during the Asian session, with the intraday high representing a test of the 76.4% retracement of the depreciating range from 1440.00 to 1234.01. Stops were later elected below a series of important technical levels, including the 1294.00, 1266.56, 1255.59, 1229.89, 1217.14, and 1190.55 levels as the recent pullback was extended. Traders are closely monitoring trading activity around some downside areas of technical support, including the 1150.21, 1133.44, 1114.28, 1096.74, 1072.78, and 1043.35 areas. If the psychologically-important 1000 figure cannot be held, technical traders will eye additional downside retracement areas including the 976.37, 954.16, 941.22, 917.03, 915.48, 902.24, 895.33, 869.22, 860.69, 856.83, 844.44, 831.94, 828.97, 812.73, 783.02, 770.03, 763.66, 750.28, 745.01, and 723.97 areas.
If ETH/USD is able to extend its recent comeback further, some areas of potential technical resistance include the 1477.71, 1582.86, and 1665.31 areas. During ETH/USD’s recent move higher to multi-year highs, Stops were recently elected above the 1072.78, 1133.44, 1163.93, 1176.28, 1225.30, and 1230.73 areas, and selling pressure intensified below these areas during the pullback. Notably, these levels represented technically significant upside price objectives related to historical buying pressure around the 215.16, 625.01, 370.50, 480.08, 530.32, and 310.79 areas. Strong Stops were also recently elected above the 819.23, 877.81, and 879.23 levels during the sharp climb, upside price objectives also related to previous buying activity around the 625.01 and 530.32 areas, and traders are curious to see how price activity reacts around these levels. Traders are observing that the 50-bar MA (4-hourly) is bullishly indicating above the 100-bar MA (4-hourly) and above the 200-bar MA (4-hourly). Also, the 50-bar MA (hourly) is bullishly indicating above the 100-bar MA (hourly) and above the 200-bar MA (hourly).

Price activity is nearest the 50-bar MA (4-hourly) at 1220.29 and the 200-bar MA (Hourly) at 1216.79.
Technical Support is expected around 792.40/ 766.54/ 729.88 with Stops expected below.
Technical Resistance is expected around 1447.83/ 1477.71/ 1582.86 with Stops expected above.
On 4-Hourly chart, SlowK is Bearishly below SlowD while MACD is Bearishly below MACDAverage.
On 60-minute chart, SlowK is Bearishly below SlowD while MACD is Bearishly below MACDAverage.
Disclaimer: This trading analysis is provided by a third party, and for informational purposes only. It does not reflect the views of Crypto Daily, nor is it intended to be used as legal, tax, investment, or financial advice.
You can share this post!
Source: Read Full Article