ETH/USD Orbiting 1000 Figure: Sally Ho’s Technical Analysis 13 January 2021 ETH
Ethereum (ETH/USD) slumped early in today’s North American session as the pair pulled back to the 1041.43 area after trading as high as the 1094.99 level during the European session. Traders lifted ETH/USD from the 980.00 area during the Asian session, a level that represented a test of the 61.8% retracement of the appreciating range from 886.33 to 1136.93. Chartists are observing ETH/USD’s vacillations between retracement levels related to the recent depreciating range from 1350.88 to 905.00, with the 1075.33 area and 1010.23 area representing the 38.2% and 23.6% retracements. Selling pressure recently saw traders elect Stops below the 1224, 1194.44, 1162.21, 1157.23, 1145.37, 1053.31, and 1002.84 levels, retracement areas that failed to provide technical support during the acute decline. If ETH/USD extends its pullback lower, downside retracement areas and additional levels of potential technical support include the 976.37, 954.16, 941.22, 917.03, 915.48, 902.24, 895.33, 869.22, 860.69, 856.83, 844.44, 831.94, 828.97, 812.73, 783.02, 770.03, 763.66, 750.28, 745.01, and 723.97 areas. During ETH/USD’s recent move higher to multi-year highs, Stops were recently elected above the 1072.78, 1133.44, 1163.93, 1176.28, 1225.30, and 1230.73 areas, and selling pressure intensified below these areas during the pullback. Notably, these levels represented technically significant upside price objectives related to historical buying pressure around the 215.16, 625.01, 370.50, 480.08, 530.32, and 310.79 areas.
Strong Stops were also recently elected above the 819.23, 877.81, and 879.23 levels during the sharp climb, upside price objectives also related to previous buying activity around the 625.01 and 530.32 areas, and traders are curious to see how price activity reacts around these levels. If ETH/USD is able to resume its recent upward buying pressure, additional upside price objectives include the 1381.03, 1439.98, 1582.86, and 1665.31 areas. Additional significant Stops were also recently elected above the 615.19, 637.79, 668.87, 679.78, and 698.88 area during the march to successive multi-year highs, and traders are curious to see how supportive those levels become during pullbacks lower. Traders are observing that the 50-bar MA (4-hourly) is bullishly indicating above the 100-bar MA (4-hourly) and above the 200-bar MA (4-hourly). Also, the 50-bar MA (hourly) is bearishly indicating below the 100-bar MA (hourly) and below the 200-bar MA (hourly).

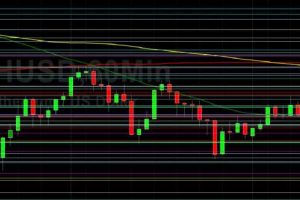
Price activity is nearest the 100-bar MA (4-hourly) at 979.54 and the 50-bar MA (Hourly) at 1059.13.
Technical Support is expected around 792.40/ 766.54/ 729.88 with Stops expected below.
Technical Resistance is expected around 1381.04/ 1419.96/ 1439.98 with Stops expected above.
On 4-Hourly chart, SlowK is Bullishly above SlowD while MACD is Bearishly below MACDAverage.
On 60-minute chart, SlowK is Bearishly below SlowD while MACD is Bullishly above MACDAverage.
Disclaimer: This trading analysis is provided by a third party, and for informational purposes only. It does not reflect the views of Crypto Daily, nor is it intended to be used as legal, tax, investment, or financial advice.
Related TAGS:
You can share this post!
Source: Read Full Article