On-Chain Metrics Turn Bullish for Bitcoin and Ethereum

Key Takeaways
- Bitcoin has seen a significant increase in idle tokens exchanging hands, which may lead to high volatility.
- The ETH supply on exchanges has plummeted, while prices sit in the “opportunity zone.”
- BTC and ETH could soon resume their uptrend if these on-chain metrics remain intact.
![]()
Bitcoin and Ethereum appear bound for high volatility as several on-chain metrics suggest that buying pressure is accelerating. Still, these cryptocurrencies must overcome one obstacle to resume the uptrend.
Bitcoin Whales Are Back

Bitcoin and Ethereum could be ready for a bullish move.
Bitcoin has rebounded strongly after diving below $41,000 earlier today. The leading cryptocurrency was able to gain over 3,500 points after the steep correction to reach a high of $43,750 at the time of writing.
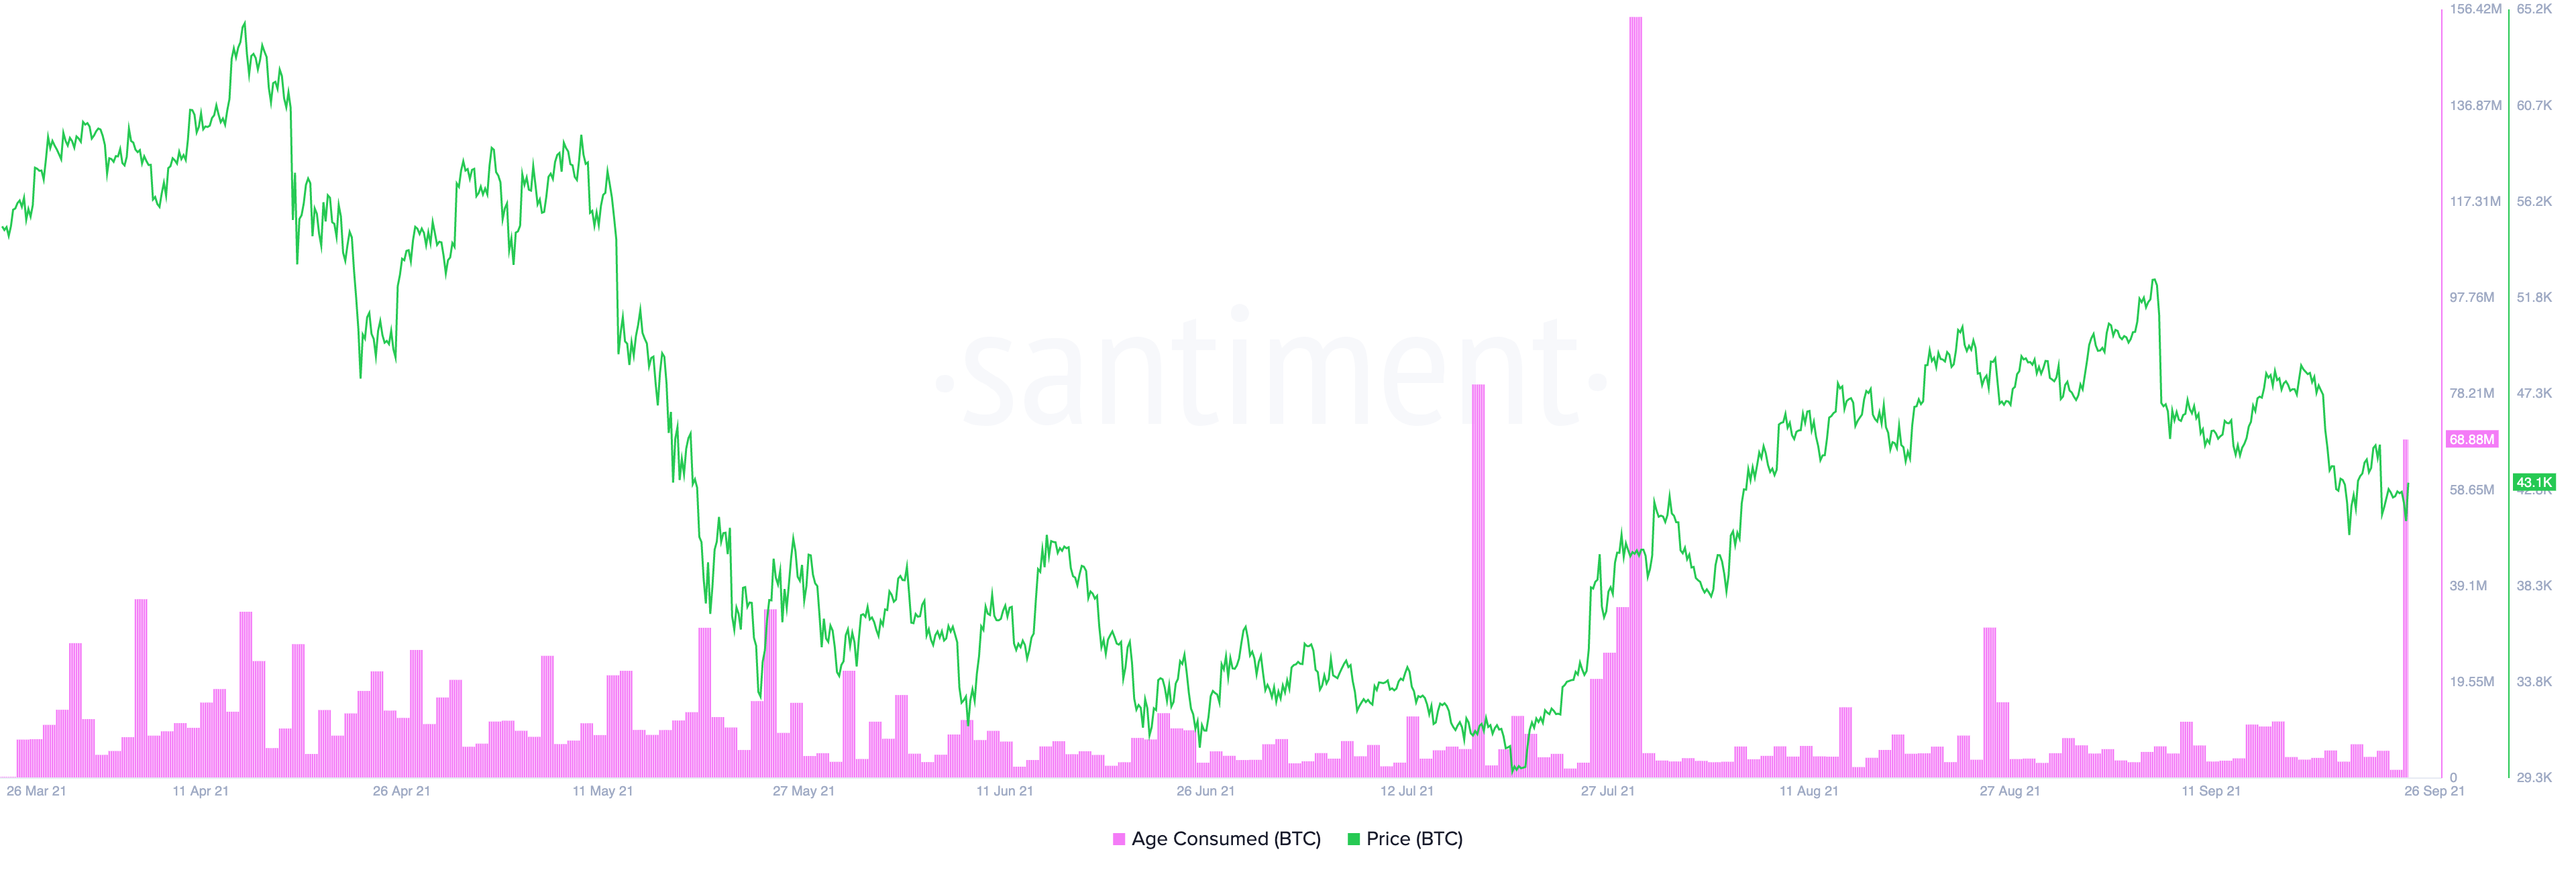
Santiment’s Token Age Consumed index recorded a significant spike in idle BTC now exchanging hands in the past few hours as prices tumbled.
This on-chain metric measures how many coins have recently moved addresses multiplied by the number of days since they last moved. Although the movement of old tokens is not necessarily a leading price indicator, it has led to spikes in volatility over the last few months.
If history repeats itself, Bitcoin could experience further volatility based on recent token movements.


![]()

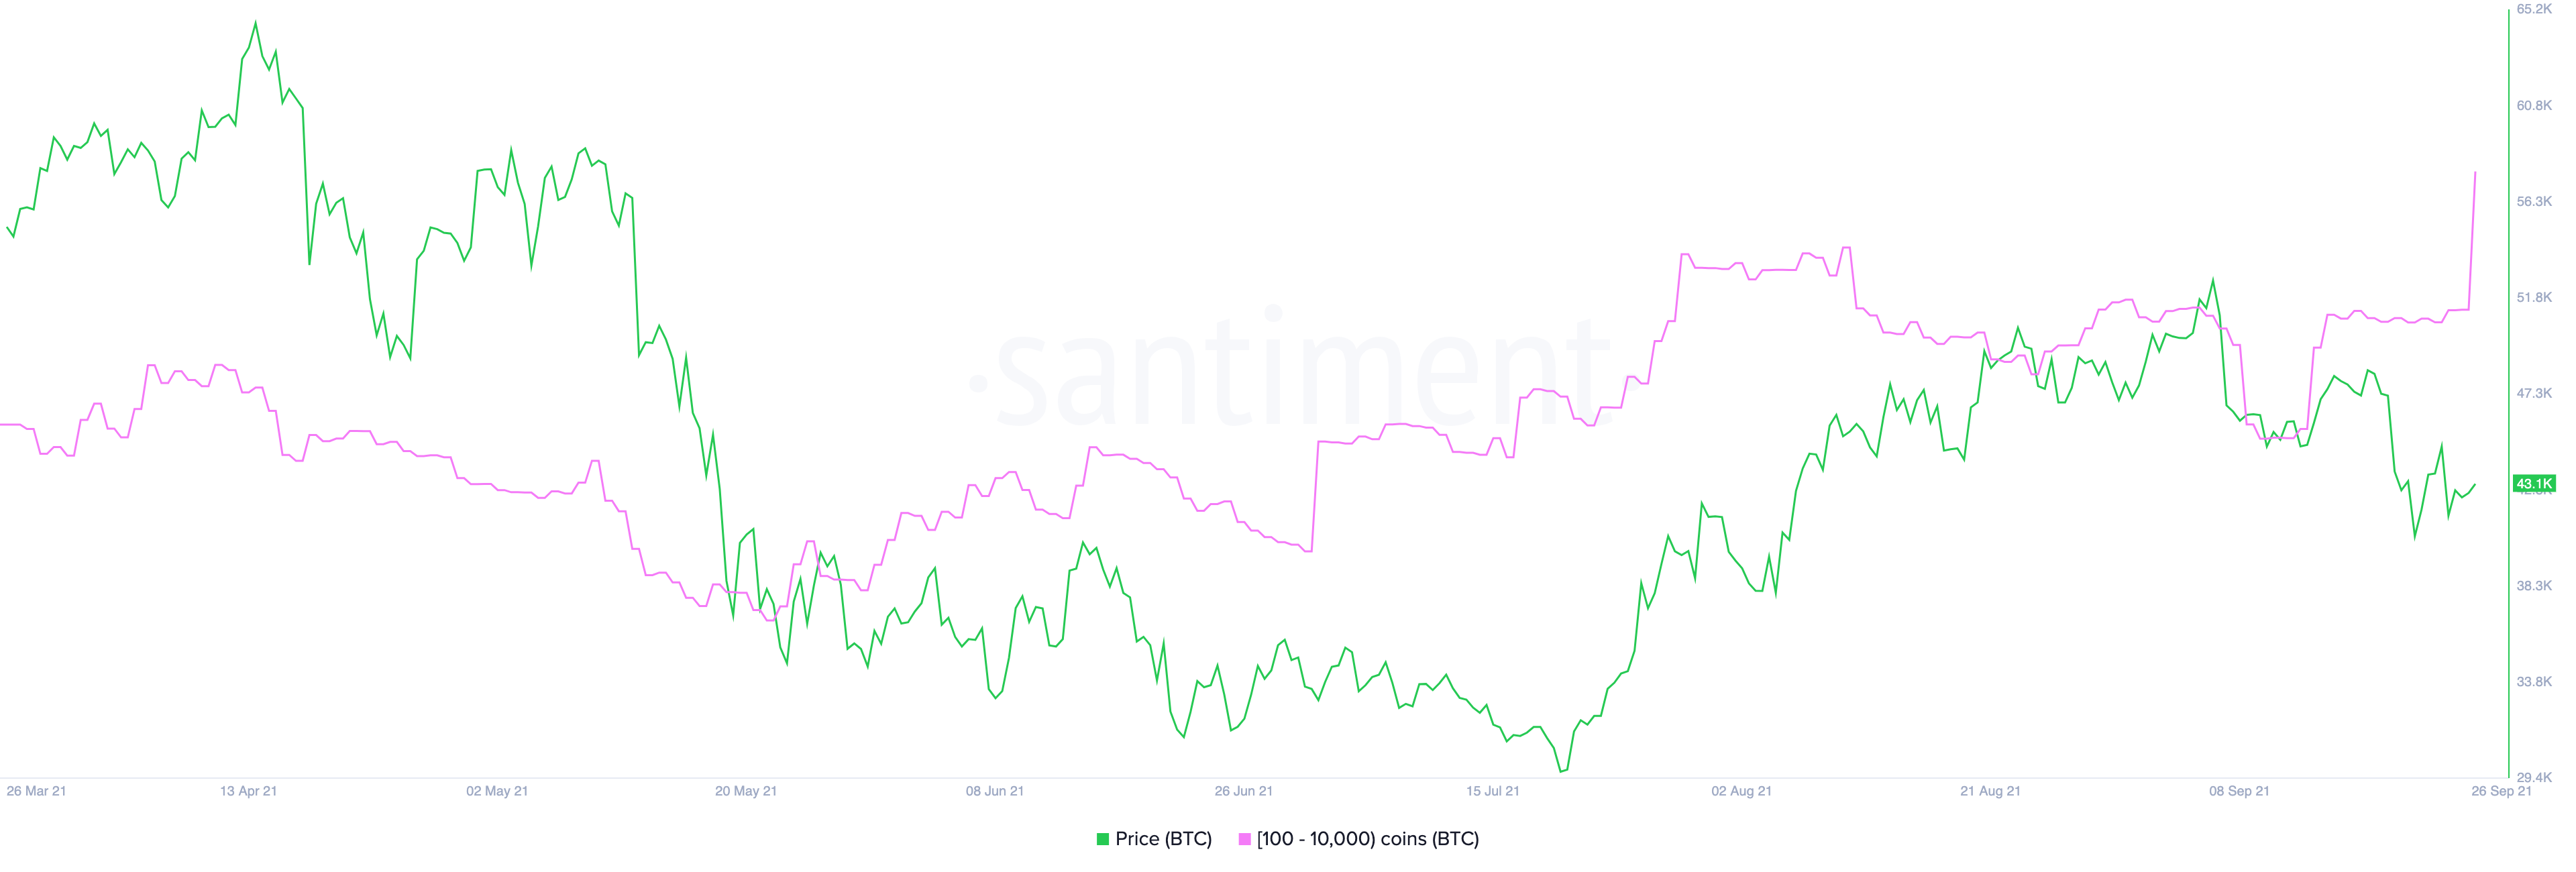
Whales behavior suggests that the incoming spike in volatility could be to the upside. In the last 24 hours, wallets on the network with 100 to 10,000 BTC have added more than 80,000 BTC to their holdings, worth $3.32 billion.
The sudden increase in upward pressure suggests that large investors are trying to buy at a discount in preparation for an upswing.
Although the odds appear to favor the bulls, Bitcoin faces stiff resistance ahead. IntoTheBlock’s In/Out of the Money Around Price (IOMAP) model shows that 1.2 million addresses have previously purchased 1.05 million BTC between $43,150 and $45,670.
These holders could be trying to break even on their underwater positions as prices attempt to advance further, containing the upward pressure. Therefore, only a decisive daily candlestick close above this supply barrier could signal the beginning of a new uptrend.
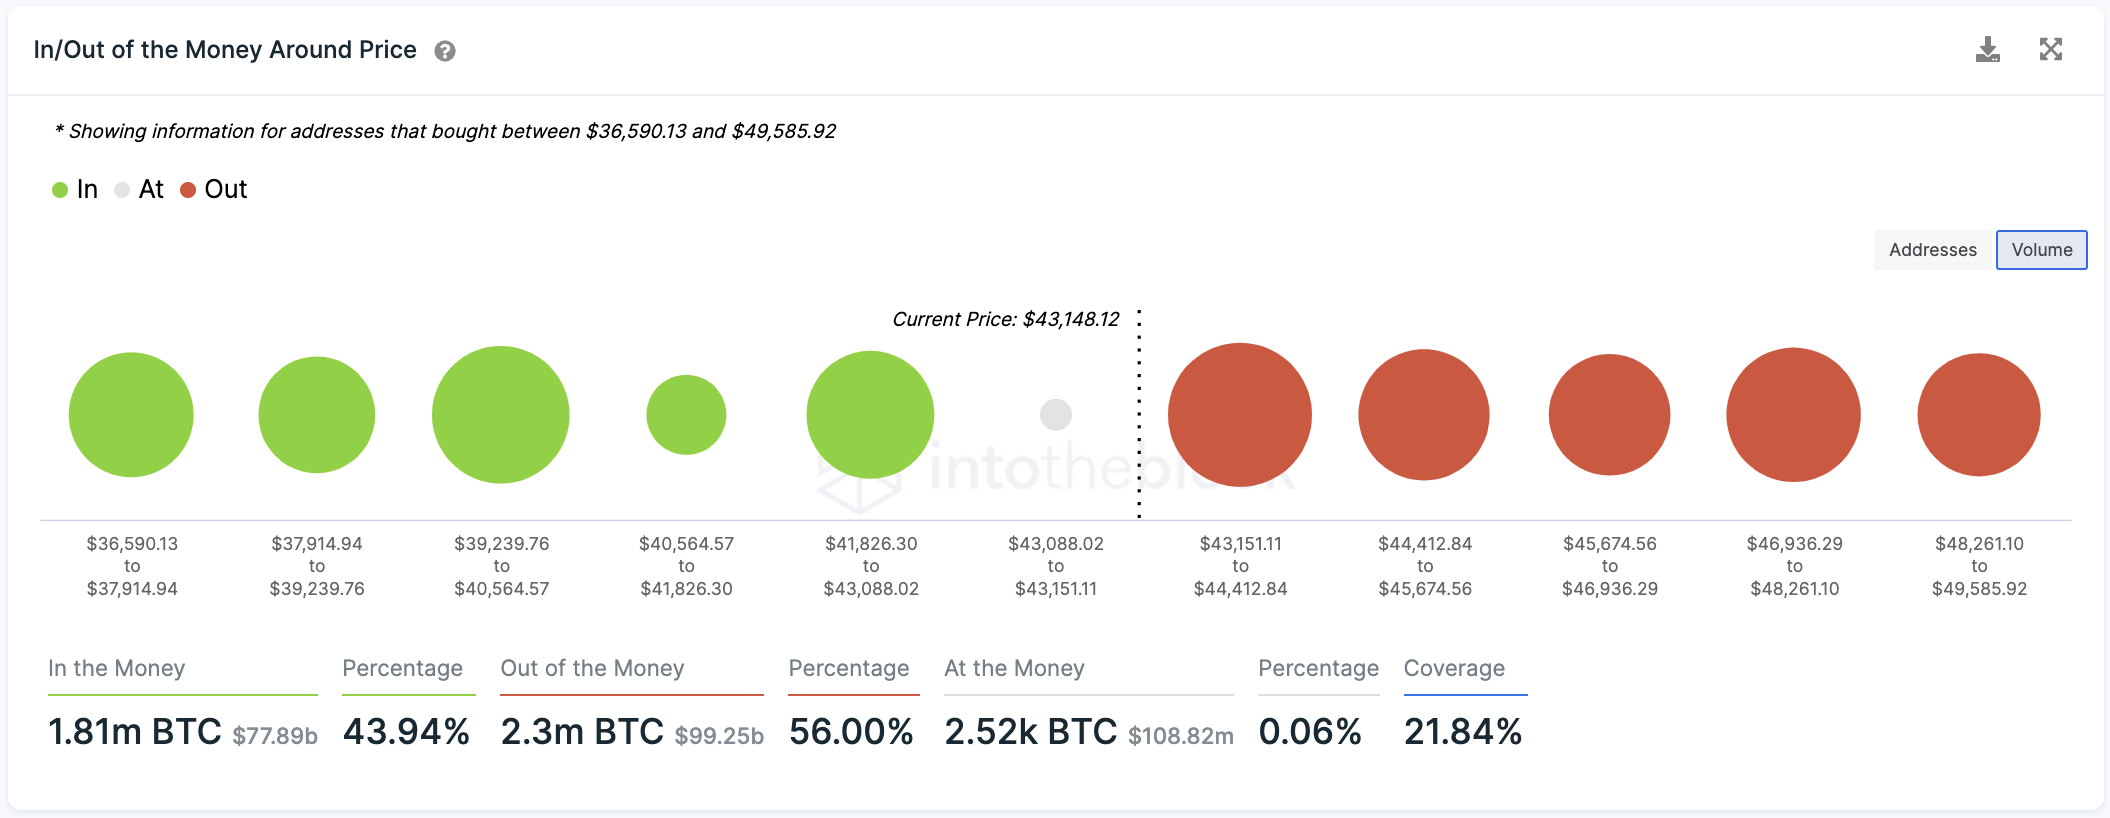
On the other hand, the IOMAP cohorts reveal that the most significant support wall underneath Bitcoin lies between $41,830 and $43,000. Roughly 760,000 addresses are holding nearly 430,000 BTC around this price level. Slicing through this demand zone could result in a downswing to $39,000 as there is no other interest area that could keep falling prices at bay.
Ethereum Looks Undervalued
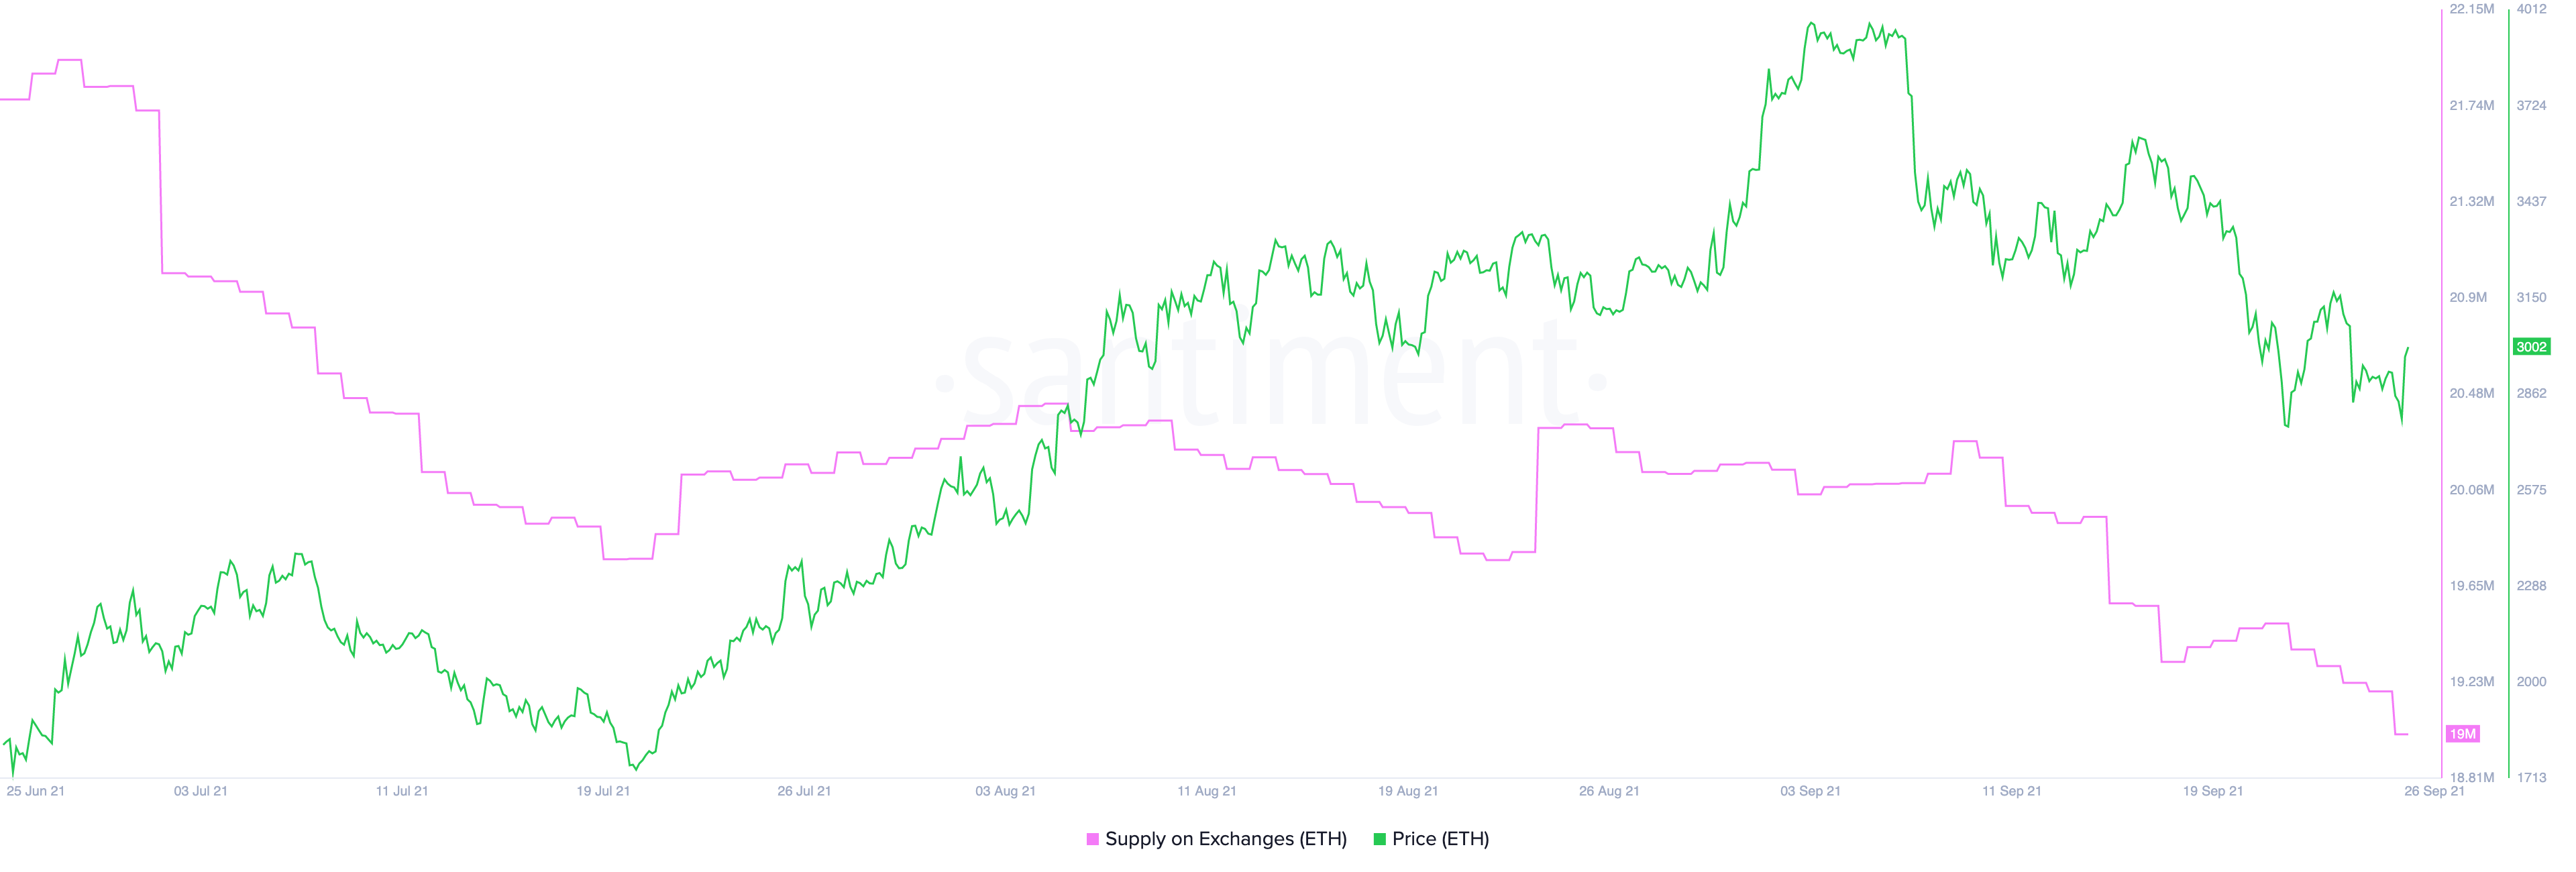
The number of Ethereum tokens held on cryptocurrency exchanges continues declining at an exponential rate. Over the last month alone, more than 1.35 million ETH have been depleted from trading platforms, representing a 6.63% decline.

The declining ETH supply on known cryptocurrency exchange wallets paints a positive picture for Ethereum’s future price growth. It technically reduces the number of ETH available to sell, consequently capping the downside potential.
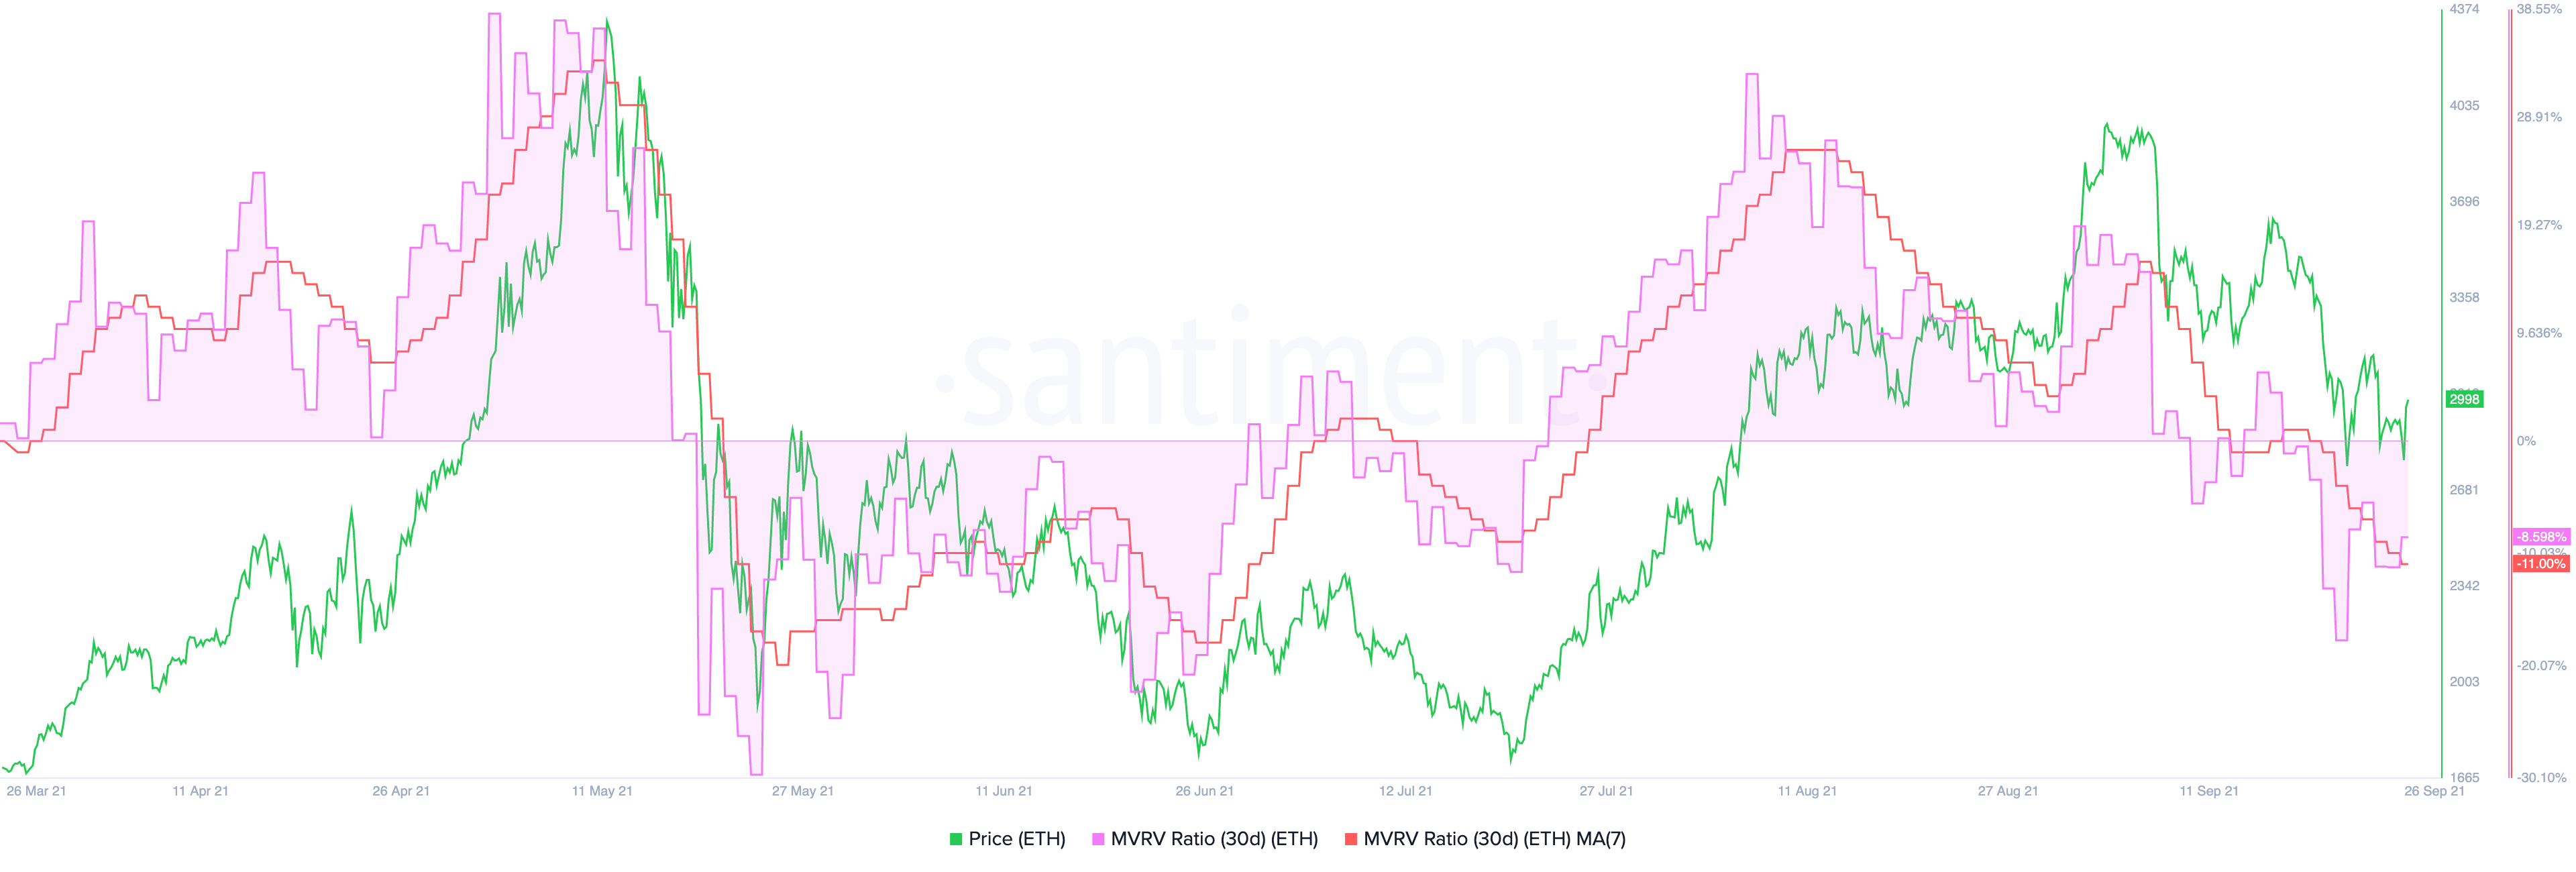
Moreover, the Market Value to Realized Value (MVRV) index suggests that Ethereum is undervalued at the current price levels. This fundamental index measures the average profit or loss of addresses that acquired ETH in the past month. Every time the 30-day MVRV moves below 0%, a bullish impulse tends to follow.
The 30-day MVRV ratio is now hovering at -8.6%, indicating that ETH sits in the “opportunity zone.” The lower the MVRV ratio becomes, the higher the probability of an upward price movement.
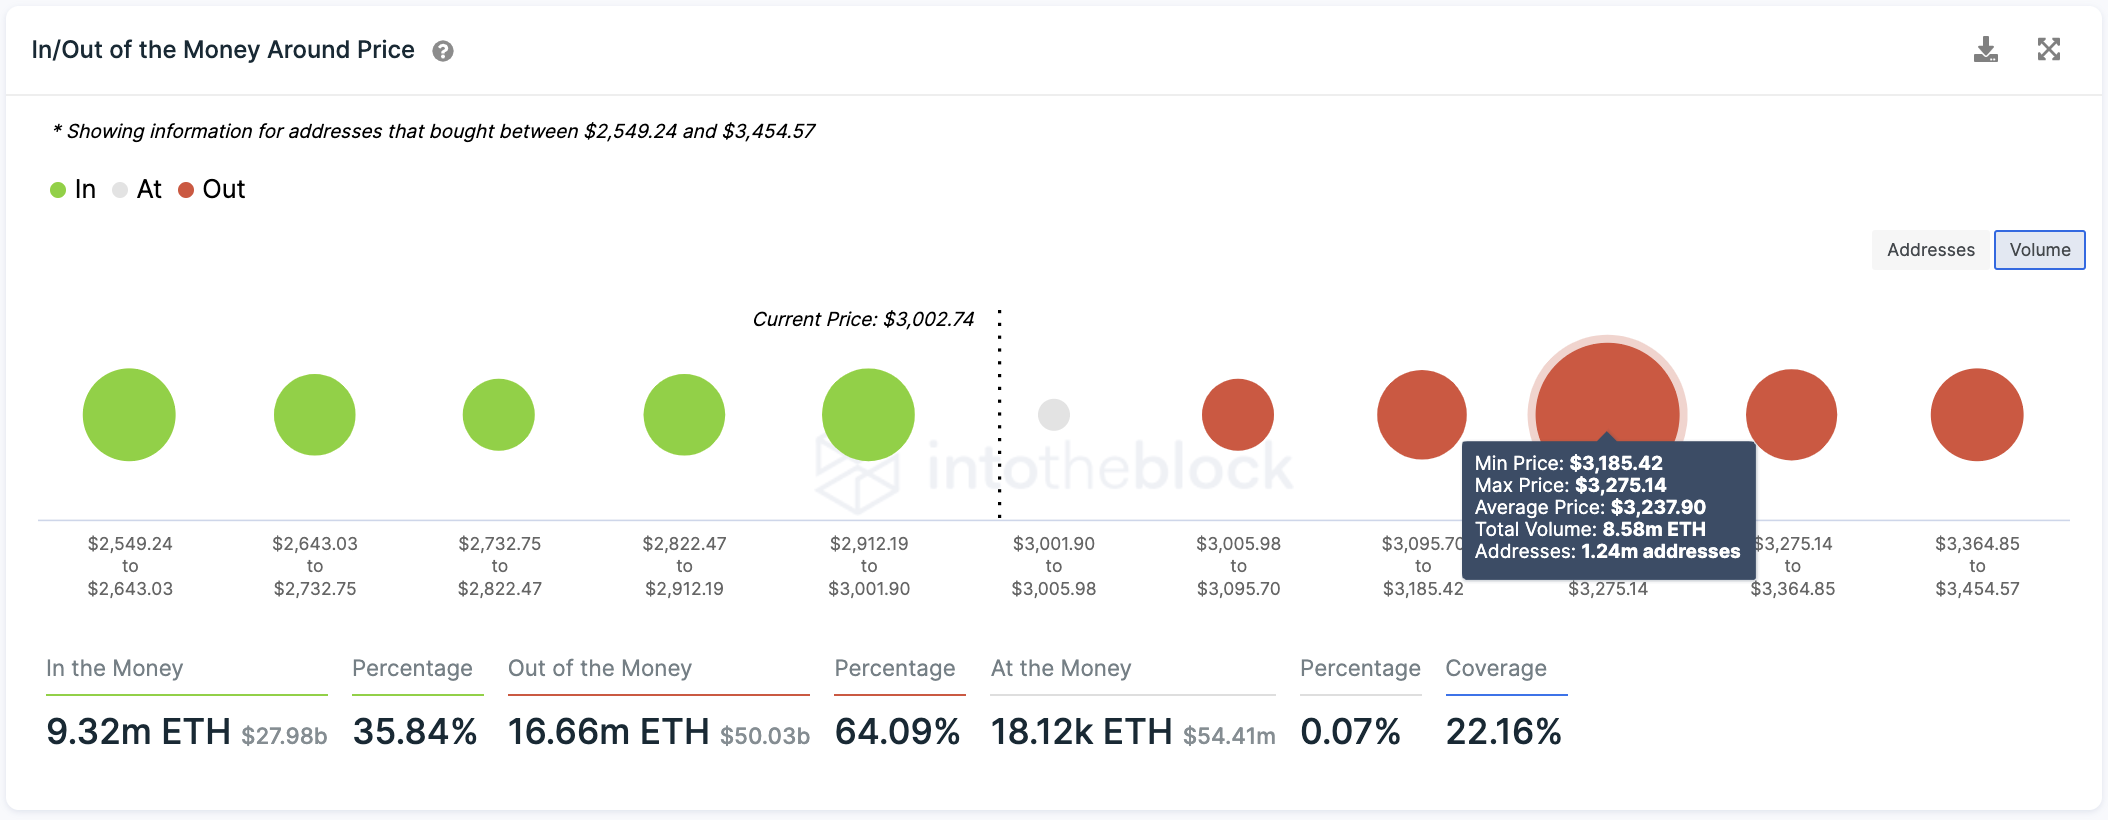
Although Ethereum is sitting on top of weak support, transaction history shows that it only has one obstacle to overcome to resume the uptrend.
More than 1.2 million addresses have acquired approximately 8.6 million ETH between $3,185 and $3,275. A decisive candlestick close above this resistance barrier could propel ETH towards $4,000 or new all-time highs.
Still, investors must pay close attention to the $2,900 support level as any signs of weakness around it could encourage market participants to sell. Under such unique circumstances, Ethereum could fall to $2,500.
![]()
The information on or accessed through this website is obtained from independent sources we believe to be accurate and reliable, but Decentral Media, Inc. makes no representation or warranty as to the timeliness, completeness, or accuracy of any information on or accessed through this website. Decentral Media, Inc. is not an investment advisor. We do not give personalized investment advice or other financial advice. The information on this website is subject to change without notice. Some or all of the information on this website may become outdated, or it may be or become incomplete or inaccurate. We may, but are not obligated to, update any outdated, incomplete, or inaccurate information.
You should never make an investment decision on an ICO, IEO, or other investment based on the information on this website, and you should never interpret or otherwise rely on any of the information on this website as investment advice. We strongly recommend that you consult a licensed investment advisor or other qualified financial professional if you are seeking investment advice on an ICO, IEO, or other investment. We do not accept compensation in any form for analyzing or reporting on any ICO, IEO, cryptocurrency, currency, tokenized sales, securities, or commodities.
See full terms and conditions.
Source: Read Full Article