XRP is on the Verge of a 30% Price Move

Key Takeaways
- Ripple’s XRP token has endured a ten-day-long consolidation period without providing any clear signals of where it is heading next.
- Only a 4-hour candlestick close above $1.26 or below $1.18 will determine the direction of its trend.
- Despite the uncertainty, the parabolic stop and reverse points have turned bullish, indicating that a breakout is underway.
![]()
Most cryptocurrencies in the market have resumed their uptrend, and some have even posted new all-time highs. Although XRP has remained stagnant over the last two weeks, multiple technical indicators suggest that it is poised to break out imminently.
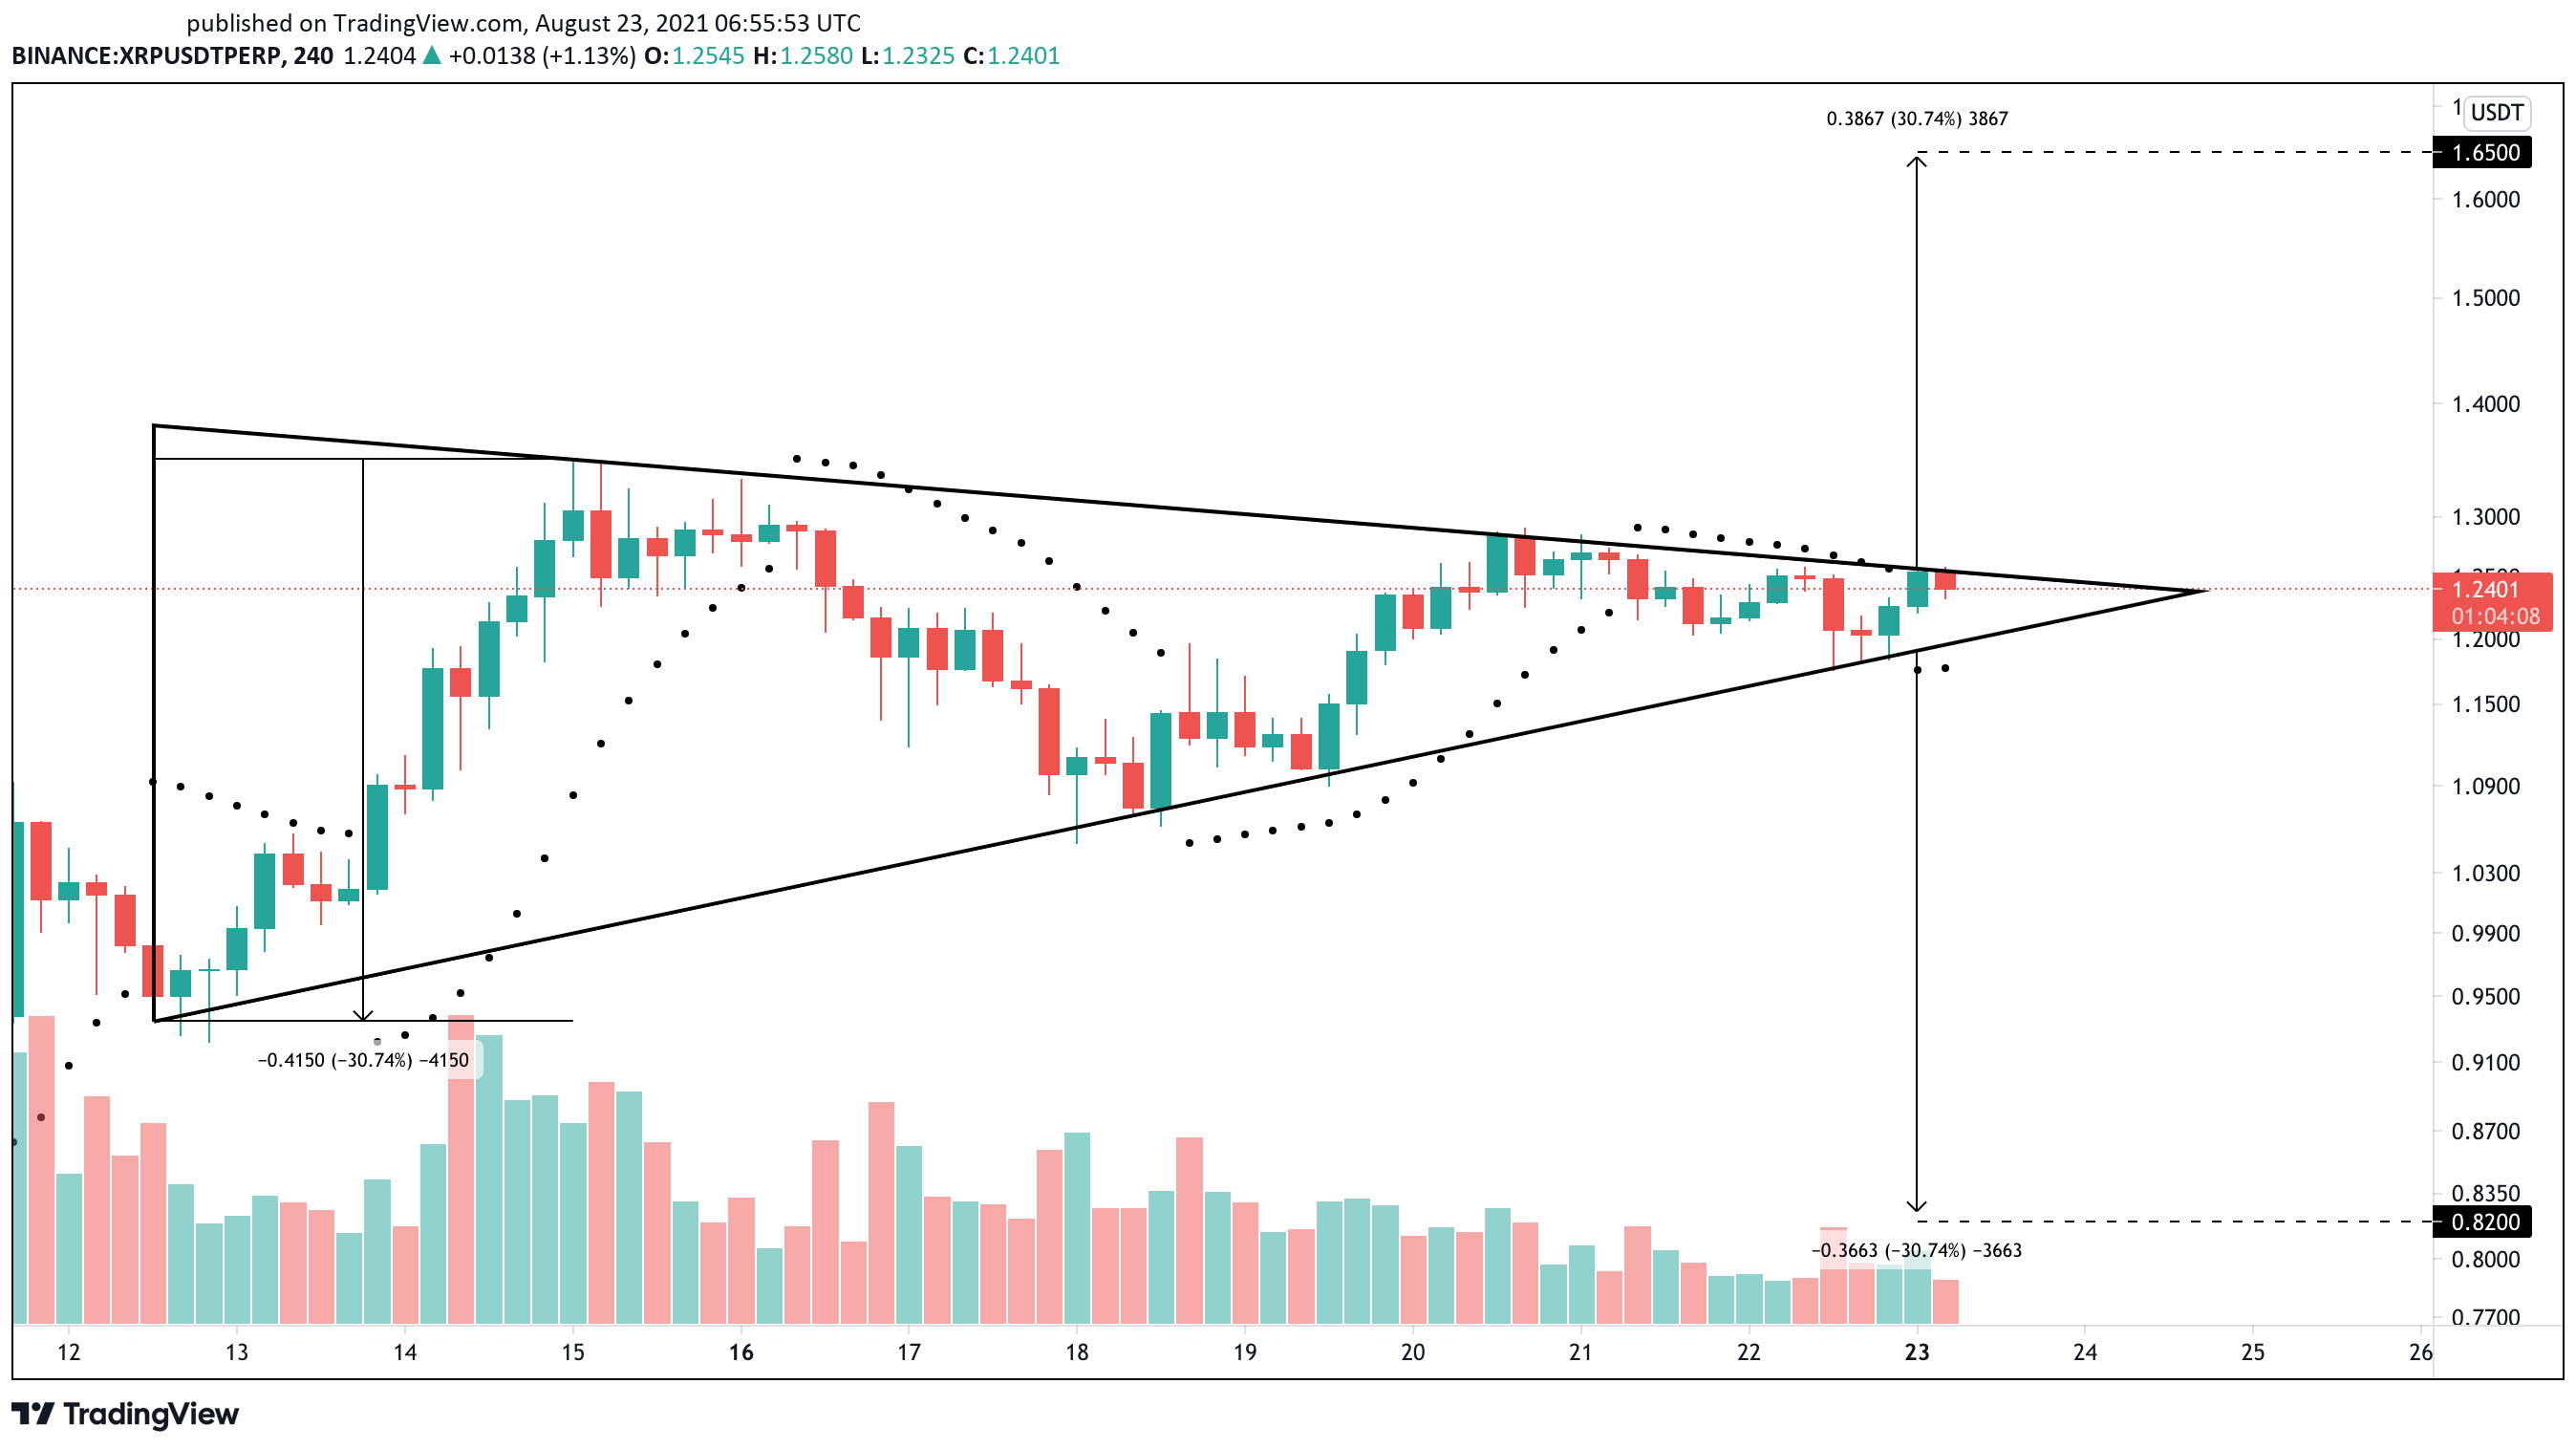
XRP Primed for Volatility

Ripple’s XRP token looks ready to make a major move.
The sixth-largest cryptocurrency by market cap has endured a ten-day-long stagnation period, making a series of lower highs and higher lows. Such price behavior has led to the formation of a symmetrical triangle on its 4-hour chart.


![]()
As XRP edges closer towards the triangle’s apex, it signals that volatility is about to strike back. A 30.74% price move would likely follow a 4-hour candlestick close above $1.26 or below $1.18.
This target is determined by measuring the height of the symmetrical triangle’s y-axis and adding it to the breakout point.
Despite the ambiguous outlook that the symmetrical triangle presents, the parabolic stop and reverse, or “SAR,” seems to be leaning toward the positive side. This trend-following indicator forecasts that the downswing seen over the weekend reached exhaustion after moving below XRP’s price on the 4-hour chart.
Historically, the stop and reversal system has been highly effective in determining the course for XRP. The last two times the parabolic SAR flipped from bearish to bullish within the 4-hour chart, XRP’s price dropped by 32.43% and 14.72%.
Similar price action could take place now that the parabolic stop and reverse points have turned bullish. A spike in buying pressure that pushes XRP beyond the triangle’s upper trend line at $1.26 could lead to a 30.74% breakout towards $1.65.
Still, traders must pay close attention to the $1.18 support level as any downswing below it may serve as an invalidation of the optimistic outlook.


The information on or accessed through this website is obtained from independent sources we believe to be accurate and reliable, but Decentral Media, Inc. makes no representation or warranty as to the timeliness, completeness, or accuracy of any information on or accessed through this website. Decentral Media, Inc. is not an investment advisor. We do not give personalized investment advice or other financial advice. The information on this website is subject to change without notice. Some or all of the information on this website may become outdated, or it may be or become incomplete or inaccurate. We may, but are not obligated to, update any outdated, incomplete, or inaccurate information.
You should never make an investment decision on an ICO, IEO, or other investment based on the information on this website, and you should never interpret or otherwise rely on any of the information on this website as investment advice. We strongly recommend that you consult a licensed investment advisor or other qualified financial professional if you are seeking investment advice on an ICO, IEO, or other investment. We do not accept compensation in any form for analyzing or reporting on any ICO, IEO, cryptocurrency, currency, tokenized sales, securities, or commodities.
See full terms and conditions.
Source: Read Full Article