Bitcoin Cash in a Sideways Trend, Struggles with $540 Overhead Resistance

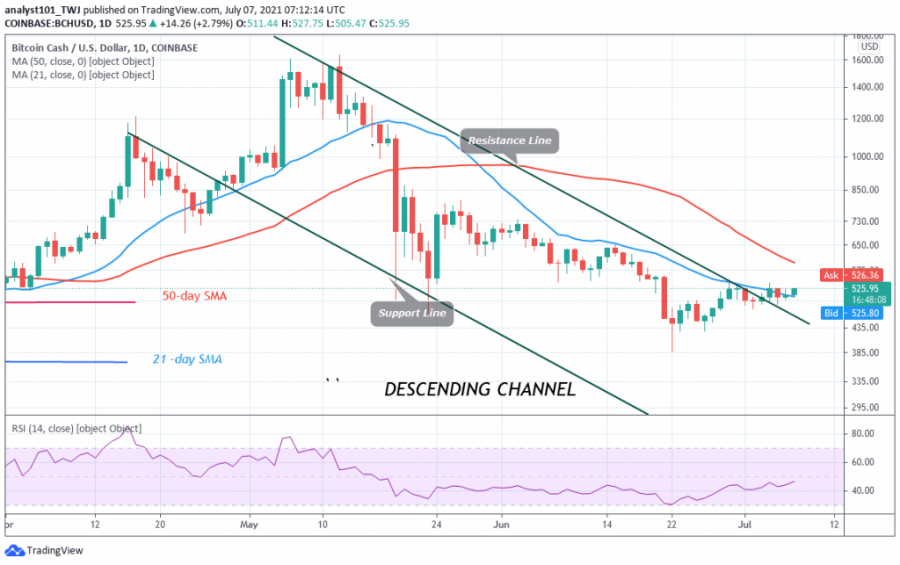
Bitcoin Cash (BCH) has made positive moves to the upside since June 23. Today, buyers are pushing the cryptocurrency higher as the market reaches the $526 high. Currently, BCH is facing a counterstand as price approaches the resistance zone.
If buyers break above $540, BCH will rise to either $740 or $820. The bulls have failed to push the altcoin above the overhead resistance. In previous price action, the bulls were pushed back on June 29 and July 4 when BCH price tried to break through. Moreover, BCH /USD is approaching the overbought region of the market. Therefore, further upside above $540 is doubtful.
Bitcoin Cash indicator reading

BCH is above the 80% area of the daily stochastic. This indicates that the market has reached the overbought zone, suggesting that sellers are likely to emerge. The 21-day and 50-day SMAs are sloping downward, indicating a downtrend. BCH /USD has risen to level 47 on the Relative Strength Index period 14. The altcoin is in the downtrend zone and below the midline 50.
Technical indicators:
Major Resistance Levels – $1,800 and $2,000
Major Support Levels – $600 and $400
What is the next step for Bitcoin Cash?
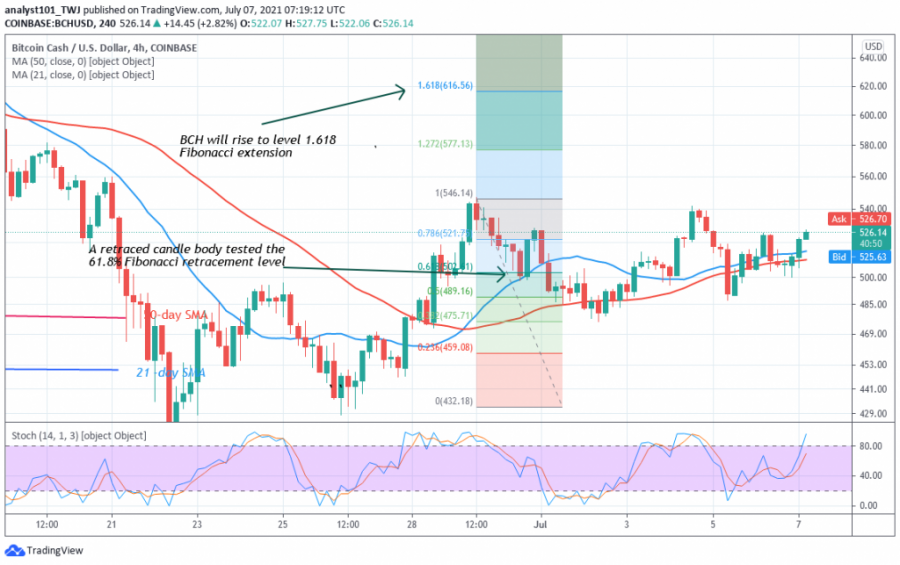
Bitcoin Cash is in a sideways trend below the $540 overhead resistance. The Fibonacci tool has indicated a possible upside move in the cryptocurrency. Meanwhile, on June 29 uptrend, a retraced candle body tested the 61.8% Fibonacci retracement. The retracement suggests that BCH will rise to the 1,618 Fibonacci Extension or the $616.56 level. From the price action, it appears that the bulls have not yet broken through the resistance at $540.
Disclaimer. This analysis and forecast are the personal opinions of the author and are a recommendation to buy or sell cryptocurrency and should not be viewed as an endorsement by Coin Idol. Readers should do their own research before investing funds.
Source: Read Full Article