BTC/USD Tests 37901 Technical Resistance: Sally Ho’s Technical Analysis 16 January 2021 BTC
Bitcoin (BTC/USD) came off early in today’s North American session as the pair depreciated to the 36701.98 area after trading as high as the 37948.00 level during the Asian session, with the intraday high right around the 61.8% retracement of the recent depreciating range from 40127.66 to 34298.93. Traders lifted BTC/USD from the 35562.72 area during the Asian session, lifting it to the 37678.23 area, before taking it lower to the 35532.20 level heading into the European session. If the recent depreciation continues, possible areas of short-term technical support include the 36604.51, 36485.14, 36248.01, 36075.89, and 35951.08 levels. Following the pair’s recent new lifetime high around the 41986.37 area, selling pressure intensified around the 41452.12 and 40164.67 areas. Stops were elected below a variety of downside retracement levels during the recent acute pullback, including the 38159.91, 37249.25, 36226.47, 35900.79, 35784.73, 35454.75, 32988.07, 32663.14, 32135.98, 31948.12, and 31414.00 levels. Following this ongoing depreciation, additional areas of potential technical support include the 29783.19, 29093.19, 28847.31, 28148.19, and 27421.33 levels.
During the recent move higher, Stops were recently elected above a series of additional upside price objectives, including the 40517.80, 40667.76, 40991.44, 41200, 41267.10, and 41489.74 levels. Stops were recently elected above the 35943.73, 36480.83, and 36854.45 areas as well, upside price objectives related to previous buying pressure around the 17580, 16200, and 9819.83 levels and the sell-off intensified below these areas during the recent depreciation. If BTC/USD is able to extend recent gains to the upside, additional upside price objectives include the 42309.01, 42701.91, 42803.53, 43447.48, and 43617.07 levels. Traders are observing that the 50-bar MA (4-hourly) is bullishly indicating above the 100-bar MA (4-hourly) and above the 200-bar MA (4-hourly). Also, the 50-bar MA (hourly) is bullishly indicating above the 100-bar MA (hourly) and above the 200-bar MA (hourly).

Price activity is nearest the 50-bar MA (4-hourly) at 37364.27 and the 200-bar MA (Hourly) at 37376.97.
Technical Support is expected around 29783.19/ 29093.19/ 28847.31 with Stops expected below.
Technical Resistance is expected around 42309.01/ 42701.91/ 42803.53 with Stops expected above.
On 4-Hourly chart, SlowK is Bullishly above SlowD while MACD is Bearishly below MACDAverage.
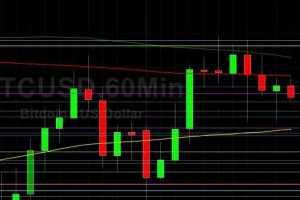
On 60-minute chart, SlowK is Bearishly below SlowD while MACD is Bullishly above MACDAverage.
Disclaimer: This trading analysis is provided by a third party, and for informational purposes only. It does not reflect the views of Crypto Daily, nor is it intended to be used as legal, tax, investment, or financial advice.
Related TAGS:
You can share this post!
Source: Read Full Article