Charted: Chainlink (LINK) Holding Uptrend Support, Why It Could Rally Again

Chainlink (LINK) rallied towards the $24.00 level before correcting lower, similar to bitcoin and Ethereum. The price is now trading near a major support zone at $20.00.
- Chainlink token price traded as high as $23.79 before starting a downside correction against the US dollar.
- The price is trading above the $20.00 support and it is well above the 100 simple moving average (4-hours).
- There is a connecting bearish trend line forming with resistance near $21.70 on the 4-hours chart of the LINK/USD pair (data source from Kraken).
- The price could extend losses towards $18.20 before starting a fresh increase in the near term.
Chainlink (LINK) Corrects Lower
After a clear break above $20.00, chainlink (LINK) extended its rally. It even surged above the $22.00 level and settled well above the 100 simple moving average (4-hours).

It traded as high as $23.79 before starting a downside correction. There was a break below the $22.00 and $21.20 support levels. There was also a clear break below a contracting triangle with support near $21.50 on the 4-hours chart of the LINK/USD pair.
The bulls lost control and the price spiked below the $20.50 level. However, the decline was limited and the price traded as low as $19.90. LINK is now trading above the $20.00 support and it is well above the 100 simple moving average (4-hours).
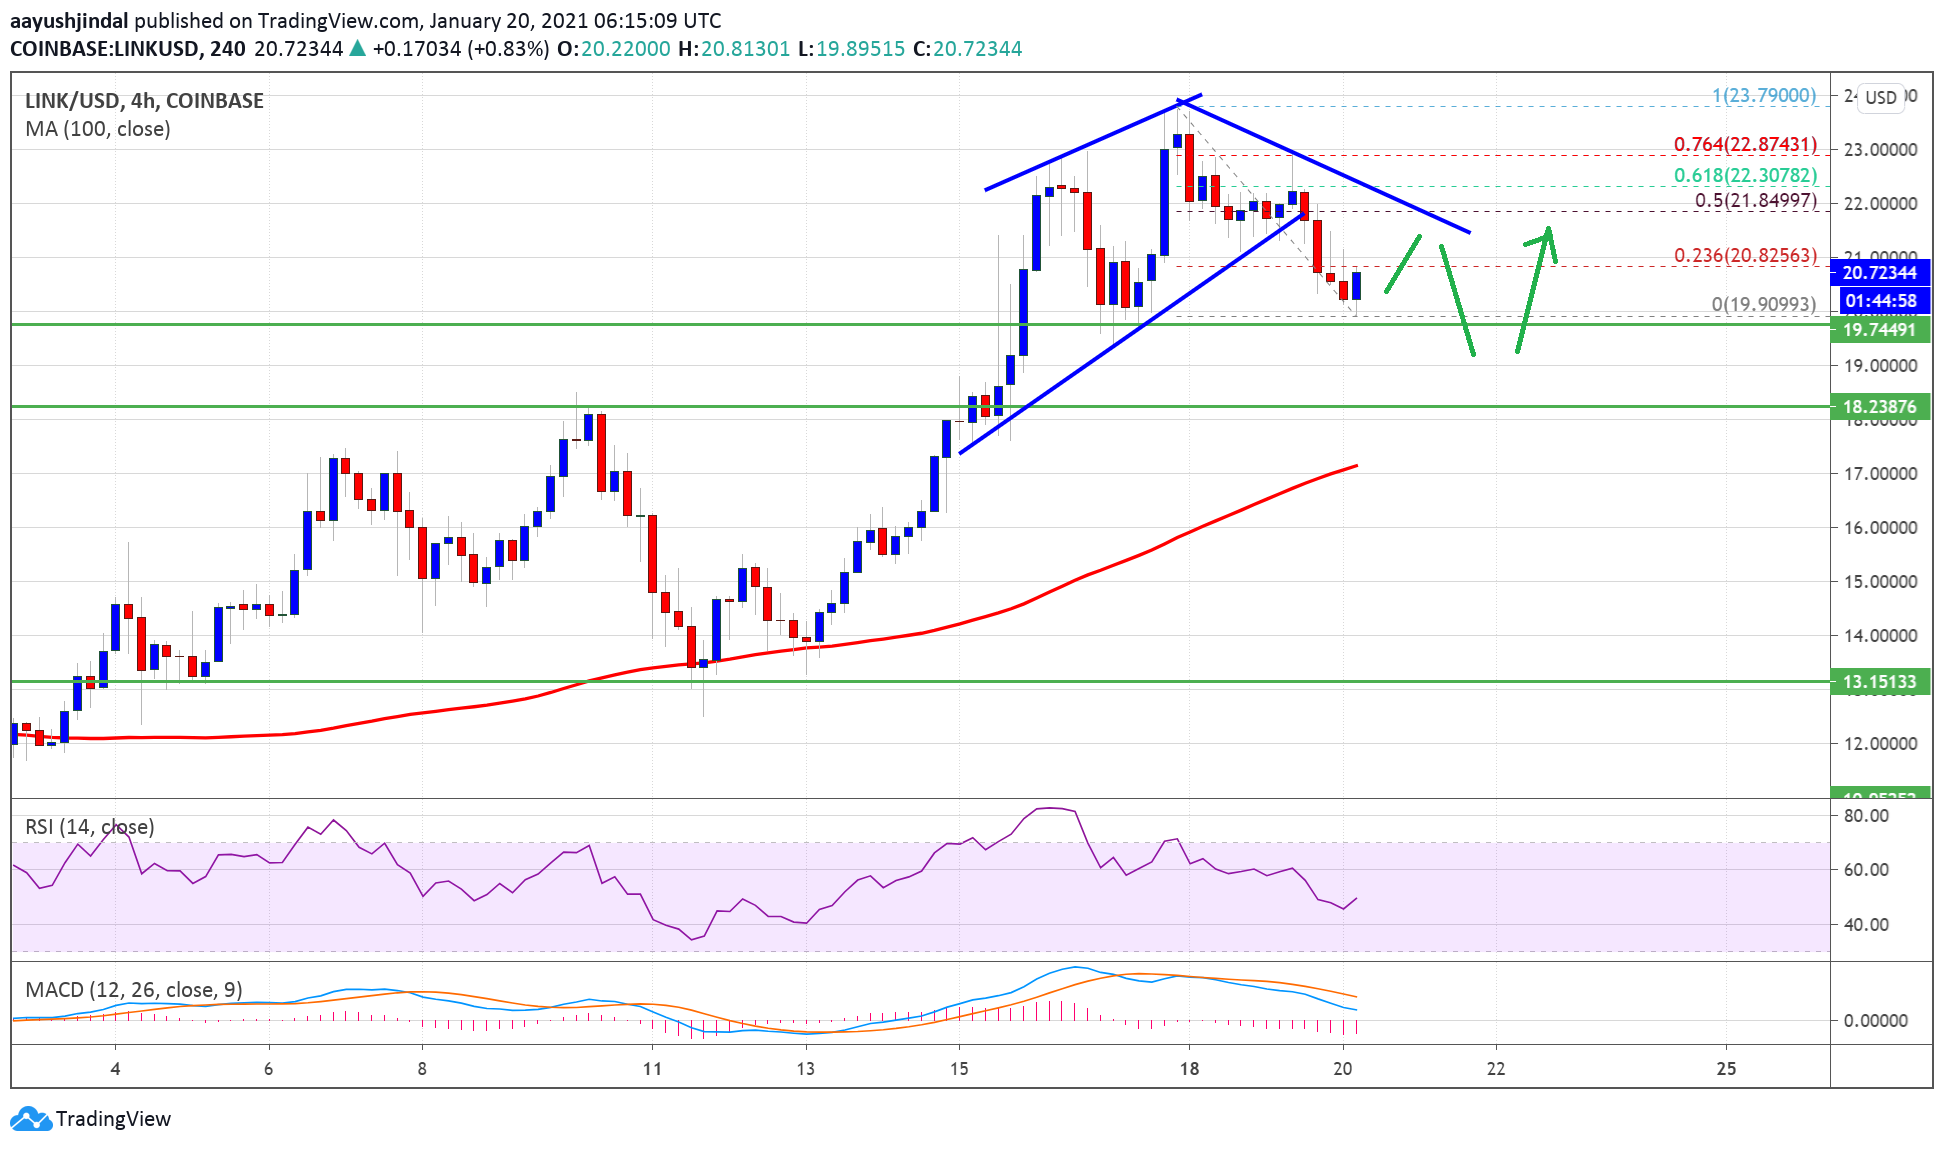
Source: LINKUSD on TradingView.com
An initial resistance for LINK is near the $20.80 level. It is close to the 23.6% Fib retracement level of the recent decline from the $23.79 high to $19.90 low.
Moreover, there is a connecting bearish trend line forming with resistance near $21.70 on the same chart. The trend line is close to the 50% Fib retracement level of the recent decline from the $23.79 high to $19.90 low. A clear break above the trend line resistance and $22.00 could open the doors for a fresh push towards $24.00 and $25.00.
More Losses?
If chainlink’s price fails to continue higher above $21.70 and $22.00, it could correct further lower. The first major support is near the $20.00 level.
The next major support is near the $18.20 level (the last breakout zone), where the bulls are likely to take a strong stand in the near term.
Technical Indicators
4-hours MACD – The MACD for LINK/USD is gaining momentum in the bearish zone.
4-hours RSI (Relative Strength Index) – The RSI for LINK/USD is currently close to the 50 level.
Major Support Levels – $20.00, $19.10 and $18.20.
Major Resistance Levels – $20.80, $21.70 and $22.00.
Source: Read Full Article