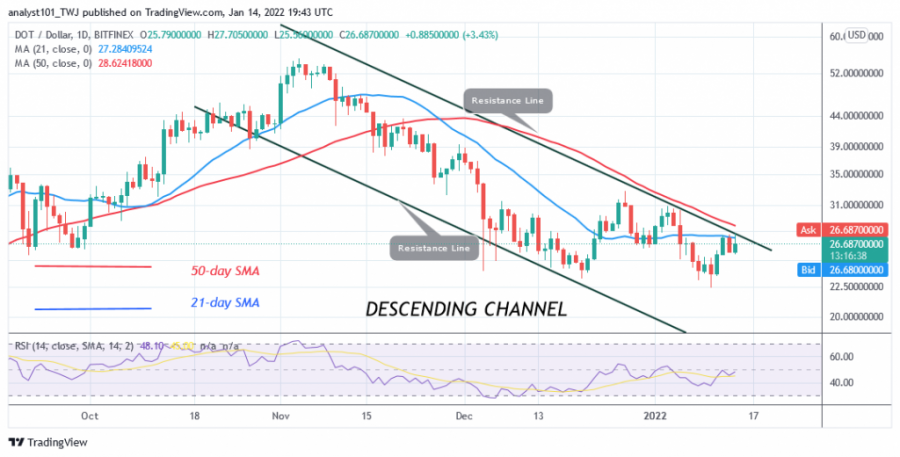
Polkadot Faces Stiff Resistance at $27 High, May Slide to $23 Low

Polkadot (DOT) is moving positively in the lower part of the chart. In the last 48 hours, buyers and sellers are engaged in a price tussle below the $27 level. The cryptocurrency will regain the previous high of $30 if buyers break the current resistance level.
Buyers have already been rejected twice when trying to break the $27 price level. On each rejection, the market drops to a low of $25.72. Today, the price of DOT drops back to the low of $25. However, if the price declines and falls below the $25 support, Polkadot will regain the previous low of $23. Meanwhile, DOT/USD falls and reaches the low of $26 at the time of writing.
Polkadot indicator analysis

The altcoin is at level 47 of the Relative Strength Index for the period 14. The cryptocurrency is in an uptrend as it is still below the midline 50. The 21-day moving averages line acts as resistance for the DOT price. Polkadot is below the 50% area of the daily stochastic. The market is in a bearish momentum.
Technical indicators:
Major Resistance Levels – $52 and $56
Major Support Levels – $28 and $24
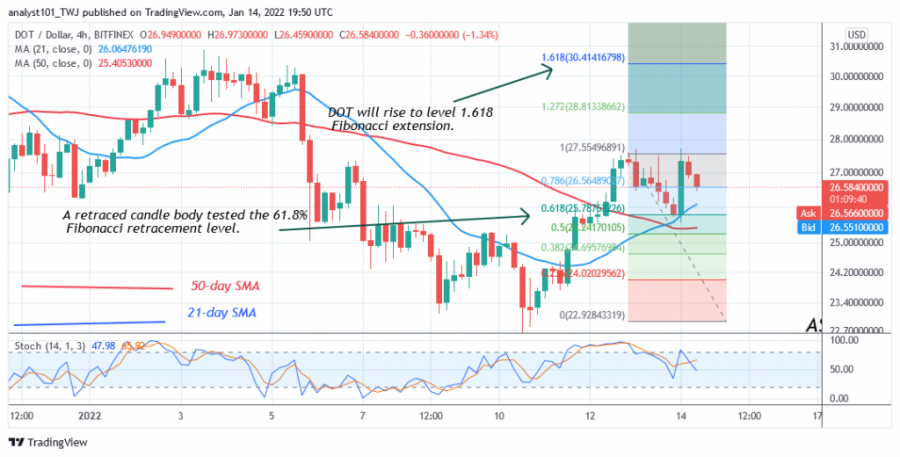
What is the next direction for Polkadot?
DOT/USD is in an upward movement. As a result of rejections, the market is fluctuating between the price levels of $25 and $27. Meanwhile, the uptrend from January 12 has shown a retracement candlestick testing the 61.8% Fibonacci retracement level. The retracement suggests that the price of DOT will rise to the 1.618 Fibonacci extension level or $30.41.
Disclaimer. This analysis and forecast are the personal opinions of the author and are not a recommendation to buy or sell cryptocurrency and should not be viewed as an endorsement by CoinIdol. Readers should do their research before investing funds.
Source: Read Full Article