Polkadot in Downward Correction, Risks Further Decline below $22

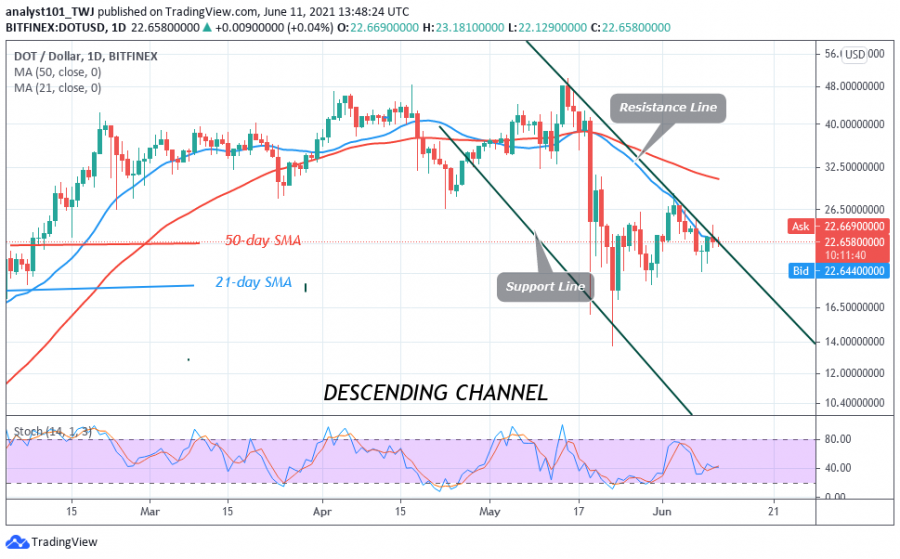
Polkadot (DOT) is consolidating above the $22 support or above the 21-day SMA.
Before now the crypto had corrected upward to the high of $28. Buyers could not sustain the bullish momentum above the $28 high. Polkadot should have regained bullish momentum if the upward correction reached the high of $35.

On June 3, DOT/USD faced rejection as the crypto’s price makes a series of lower highs and lower lows. The crypto fell to a $22 low after making lower highs of $24. On the downside, the altcoin will decline to $19, if the bears break below the moving averages. However, if the crypto rebounds above the current support, the upward move will resume on the upside. On June 1, the DOT price rebounded above the $22 support as the altcoin reached the high of $28.
Polkadot indicator analysis
DOT price is below the 21-day and the 50-day SMA which makes the upward move doubtful. The altcoin price will continue to decline as long the price is below the SMAs. DOT price is in a bearish momentum as it is below the 60% range of the daily stochastic. The 21-day and the 50-day SMA are sloping southward indicating the downtrend.
Technical indicators:
Major Resistance Levels – $48 and $52
Major Support Levels – $22 and $18
What is the next direction for Polkadot?
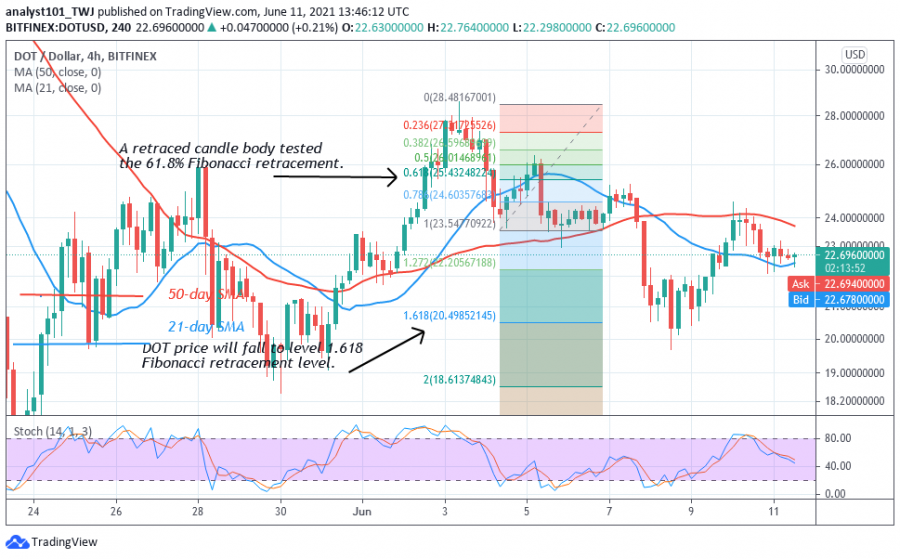
Polkadot is in a downward move. Meanwhile, on June 4 downtrend; a retraced candle body tested the 61.8% Fibonacci retracement level. The retracement indicates that DOT will fall to level 1.618 Fibonacci extensions or level $20.49. From the price action, DOT price tested the Fibonacci level and pulled back to $24 high.
Disclaimer. This analysis and forecast are the personal opinions of the author and are not a recommendation to buy or sell cryptocurrency and should not be viewed as an endorsement by CoinIdol. Readers should do their research before investing funds.
Source: Read Full Article