Ripple Holds Above $0.36 For Possible Rebound

Ripple (XRP) is in a downtrend as it is below the moving average lines.
Long term forecast for Ripple price: bearish
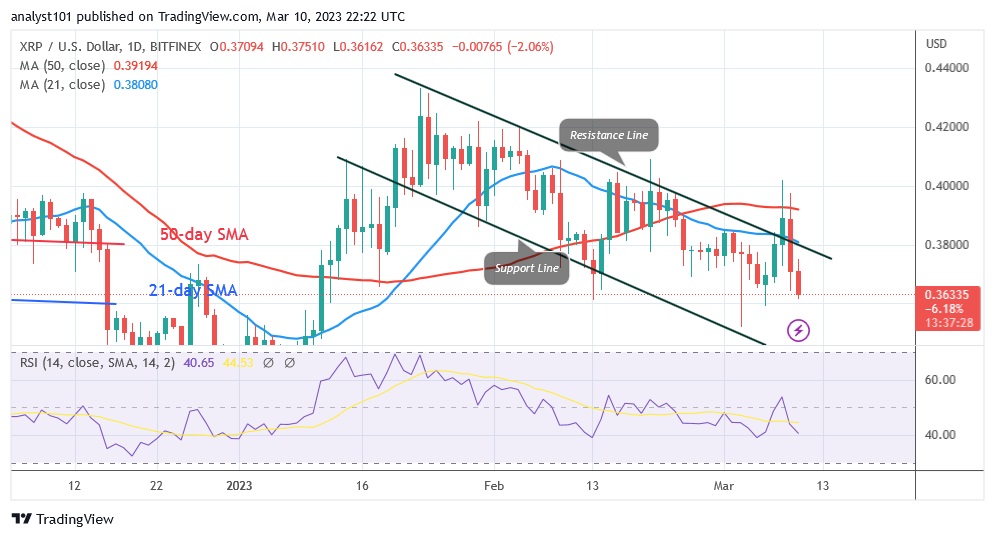
On March 8 and 9, traders engaged in a price war. Buyers were able to keep the price above the moving average lines on March 8, but selling pressure occurred at the recent high. The bullish momentum was broken when XRP fell below the moving average lines. The cryptocurrency value has now fallen to a low of $0.36. The current support is the historical price level from January 18. The altcoin has tested and resumed its upward movement four times, but remains above this level at the time of writing. If the current support holds, Ripple will regain its upward momentum. The market will rise and retrace its steps to the previous highs of $0.40 and $0.42. If the current support is broken, XRP will return to its previous low of $0.34.
Ripple indicator analysis

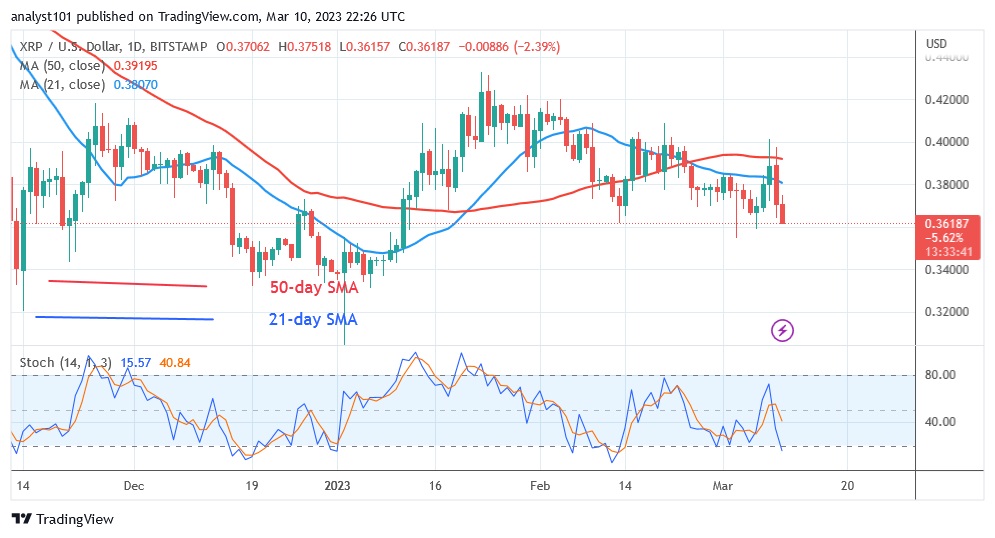
For the period 14, Ripple is in the bearish trend zone at 40 on the Relative Strength Index. With the price bars falling below the moving average lines, it is likely that XRP will fall. With the daily stochastic below the 20 level, XRP has entered the oversold zone. The bearish selling pressure has reached its limit.
Technical indicators:
Key resistance levels – $0.80 and $1.00
Key support levels – $0.40 and $0.20
What is the next move for Ripple?
Ripple is falling and has reached its previous low of $0.36. The current decline has the potential to extend to the previous lows of $0.35 and $0.34. The altcoin is moving above current support in preparation for a potential bounce. As selling pressure eases, XRP has reached oversold territory.
Disclaimer. This analysis and forecast are the personal opinions of the author and are not a recommendation to buy or sell cryptocurrency and should not be viewed as an endorsement by CoinIdol. Readers should do their own research before investing
Source: Read Full Article