Ripple Price Analysis: Recovery Faces Resistance Near $0.88
Ripple price is showing bearish signs below $0.92 against the US Dollar, unlike bitcoin. XRP price remains at a risk of more losses below the $0.7820 support.
Ripple Price Analysis
After a minor upward move, ripple price faced sellers near the $0.9500 level against the US Dollar. The XRP/USD pair started a fresh decline below the $0.9200 support zone.

The pair even declined below the $0.8880 support and the 55 simple moving average (4-hours). There was a test of the 50% Fib retracement level of the upward move from the $0.6315 swing low to $0.9344 high. It even tested the $0.7800 support zone.
On the downside, an initial support is near the $0.7820 level. The first major support is near the $0.7500 level. It is near the 61.8% Fib retracement level of the upward move from the $0.6315 swing low to $0.9344 high. Any more losses could lead the price towards the $0.7000 level in the near term.
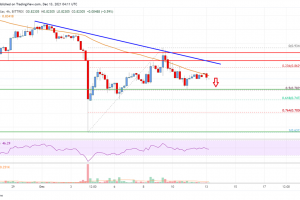
On the upside, the price is facing resistance near the $0.8500 level. The next key resistance is near the $0.8700 level. There is also a key bearish trend line forming with resistance near $0.8750 on the 4-hours chart of the XRP/USD pair.
A close above the $0.88 level could increase the chances of a break above the key $0.90 resistance zone. The next major resistance is near the $0.950 level. Any more gains could lead the price towards the $1.10 level. An intermediate resistance might be near the $1.00 level.

Ripple Price
Looking at the chart, ripple price is now trading below $0.90 and the 55 simple moving average (4-hours). Overall, the price could continue to move down if there is no recovery wave above $0.8880.
Technical indicators
4 hours MACD – The MACD for XRP/USD is now gaining momentum in the bearish zone.
4 hours RSI (Relative Strength Index) – The RSI for XRP/USD is still below the 50 level.
Key Support Levels – $0.7800, $0.75 and $0.70.
Key Resistance Levels – $0.8800 and $0.9200.
Source: Read Full Article