Ripple Rallies as It Challenges Resistance at $0.38

The price of Ripple (XRP) is in an uptrend as it breaks the moving average lines.
Ripple price long-term forecast: bearish
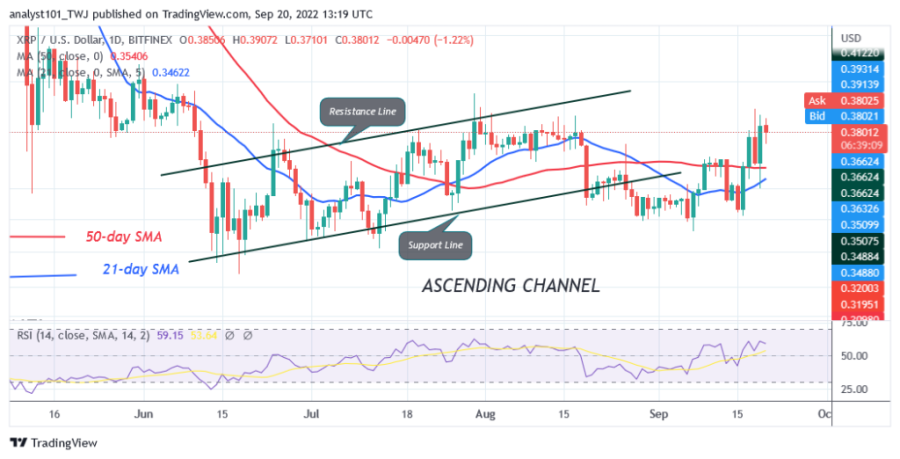
On September 16, XRP rose above the $0.32 support and rallied above the moving average lines. The altcoin reached the high of $0.38 but retreated above the moving average lines. The upward movement will continue as long as the price bars remain above the moving average lines. If the bulls overcome the resistance at $0.38, XRP will rise to $0.44. However, XRP will fall sharply below the moving average if it is rejected at the $0.38 resistance. In the last price action, XRP fell below the moving average lines and above the support of $0.32.
Ripple indicator analysis
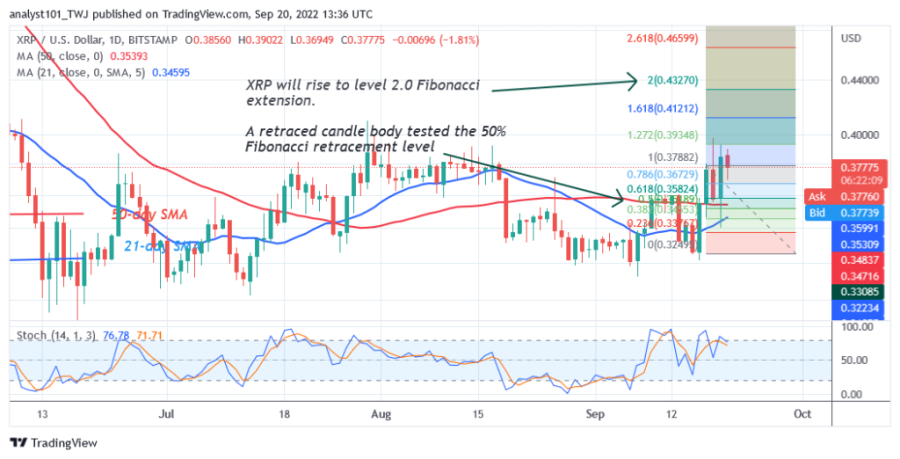
Ripple is at level 60 of the Relative Strength Index for the period 14. XRP is in the uptrend zone after the recent price rally. The price bars of XRP are above the moving average lines, which indicate further upward movement. The altcoin is below the 80% area of the daily stochastic. This indicates that XRP is in a bearish momentum. The moving average lines are sloping north, indicating an uptrend. The altcoin has reached the overbought zone after the recent price increase.
Technical Indicators
Key resistance zones: $0.40, $0.45, $0.50
Key support zones: $0.30, $0.25, $0.20
What is the next step for Ripple?
Ripple has regained bullish momentum after the price breakout. The uptrend is hindered by the resistance zone at $0.38. The cryptocurrency can rise as it is above the moving average lines. Meanwhile, on September 17 uptrend; a retraced candle body tested the 50% Fibonacci retracement level. XRP will rise to the level 2.0 Fibonacci extension or $ 0.43 high.
Disclaimer. This analysis and forecast are the personal opinions of the author and are not a recommendation to buy or sell cryptocurrency and should not be viewed as an endorsement by CoinIdol. Readers should do their own research before investing
Source: Read Full Article


