TA: Bitcoin Price Struggles Near $54K, Why It Could Slide Again

Bitcoin price declined over $5,000 and tested the $45,000 support against the US Dollar. BTC is now correcting losses, but it is facing a strong resistance near $54,000 and $55,000.
- Bitcoin is struggling to climb back above the $54,000 and $55,000 resistance levels.
- The price is now well below $55,000 and the 100 hourly simple moving average.
- There was a break below a major bullish trend line with support near $54,500 on the hourly chart of the BTC/USD pair (data feed from Kraken).
- The same trend line support and $55,000 are now acting as a strong resistance.
Bitcoin Price is Showing Signs of More Losses
After forming a short-term top, bitcoin price started a sharp decline below the $56,000 level. BTC broke the key $55,000 support level and the 100 hourly simple moving average to move into a bearish zone.

There was also a break below a major bullish trend line with support near $54,500 on the hourly chart of the BTC/USD pair. The pair crashed over $5,000 and it even spiked below the $50,000 support. It tested the $45,000 support before correcting higher.
There was a break above the $50,000 and $52,000 levels. The price even climbed above the 50% Fib retracement level of the downward move from the $58,350 swing high to $45,000 swing low.
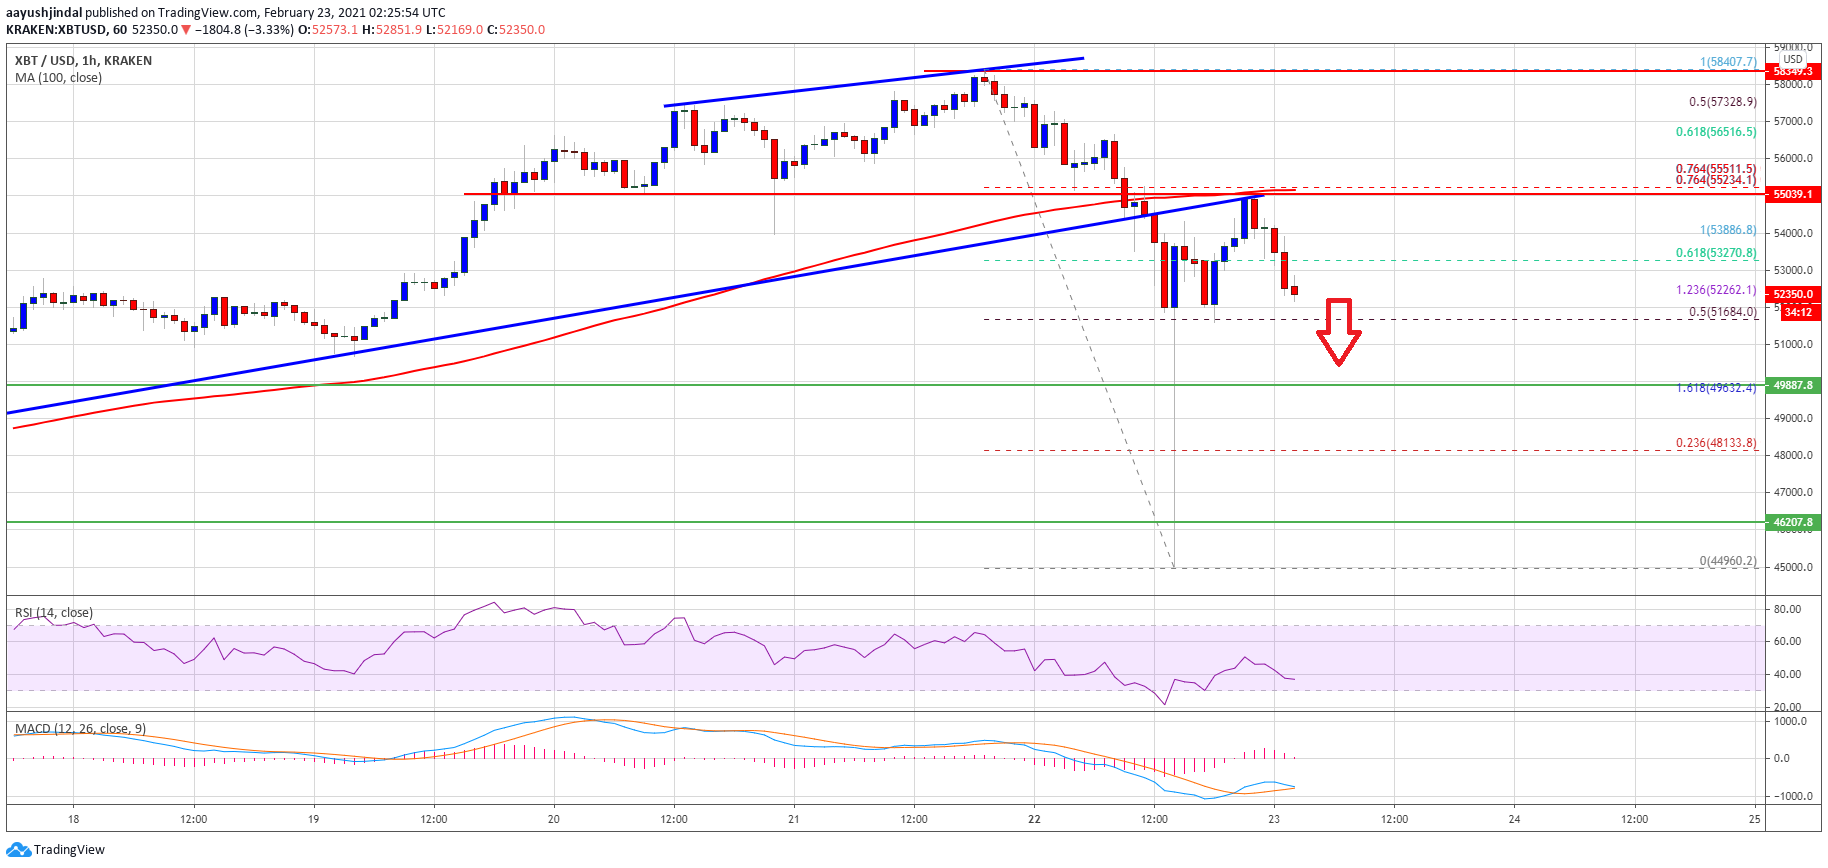
Source: BTCUSD on TradingView.com
However, the same trend line support and $55,000 are now acting as a strong resistance. The 100 hourly simple moving average is also near the $55,000 level along with the 76.4% Fib retracement level of the downward move from the $58,350 swing high to $45,000 swing low.
Bitcoin is now moving lower and it seems like it could revisit the $50,000 support level. If the price fails to stay above $50,000, it could decline towards the $46,200 support.
Upsides Capped in BTC?
If bitcoin remains stable above the $50,000 level, it could make another attempt to settle above $54,000. The first major resistance is near the $55,000 level and the 100 hourly SMA.
To start a fresh increase and move into a positive zone, the price must clear $55,000. The next major resistance sits near the $57,000 level.
Technical indicators:
Hourly MACD – The MACD is gaining momentum in the bearish zone.
Hourly RSI (Relative Strength Index) – The RSI for BTC/USD is well below the 50 level.
Major Support Levels – $52,000, followed by $50,000.
Major Resistance Levels – $54,000, $55,000 and $57,000.
Source: Read Full Article