TA: Bitcoin Signaling Further Correction, Why BTC Could Revisit $33K

Bitcoin price failed to clear the $37,500 and $37,800 resistance levels against the US Dollar. BTC is currently moving lower and it could continue to move down towards $34,000 or $33,000.
- Bitcoin is facing a strong resistance near the $37,800 and $38,000 resistance levels.
- The price is now trading below the $36,500 support and the 100 hourly simple moving average.
- There was a break below a major contracting triangle with support near $36,500 on the hourly chart of the BTC/USD pair (data feed from Kraken).
- The pair is showing bearish signs and it could decline further towards $34,000 or $33,000.
Bitcoin Price is Grinding Lower
After another failed attempt above the $37,000 resistance, bitcoin price started a fresh decline. A swing high was formed near $37,861 before the price corrected lower.

It broke the $37,000 and $36,800 support levels. More importantly, there was a break below a major contracting triangle with support near $36,500 on the hourly chart of the BTC/USD pair. The price is now trading below the $36,500 support and the 100 hourly simple moving average.
An initial support on the downside is near the $35,850 level. It is close to the 50% Fib retracement level of the upward move from the $33,878 swing low to $37,861 high.
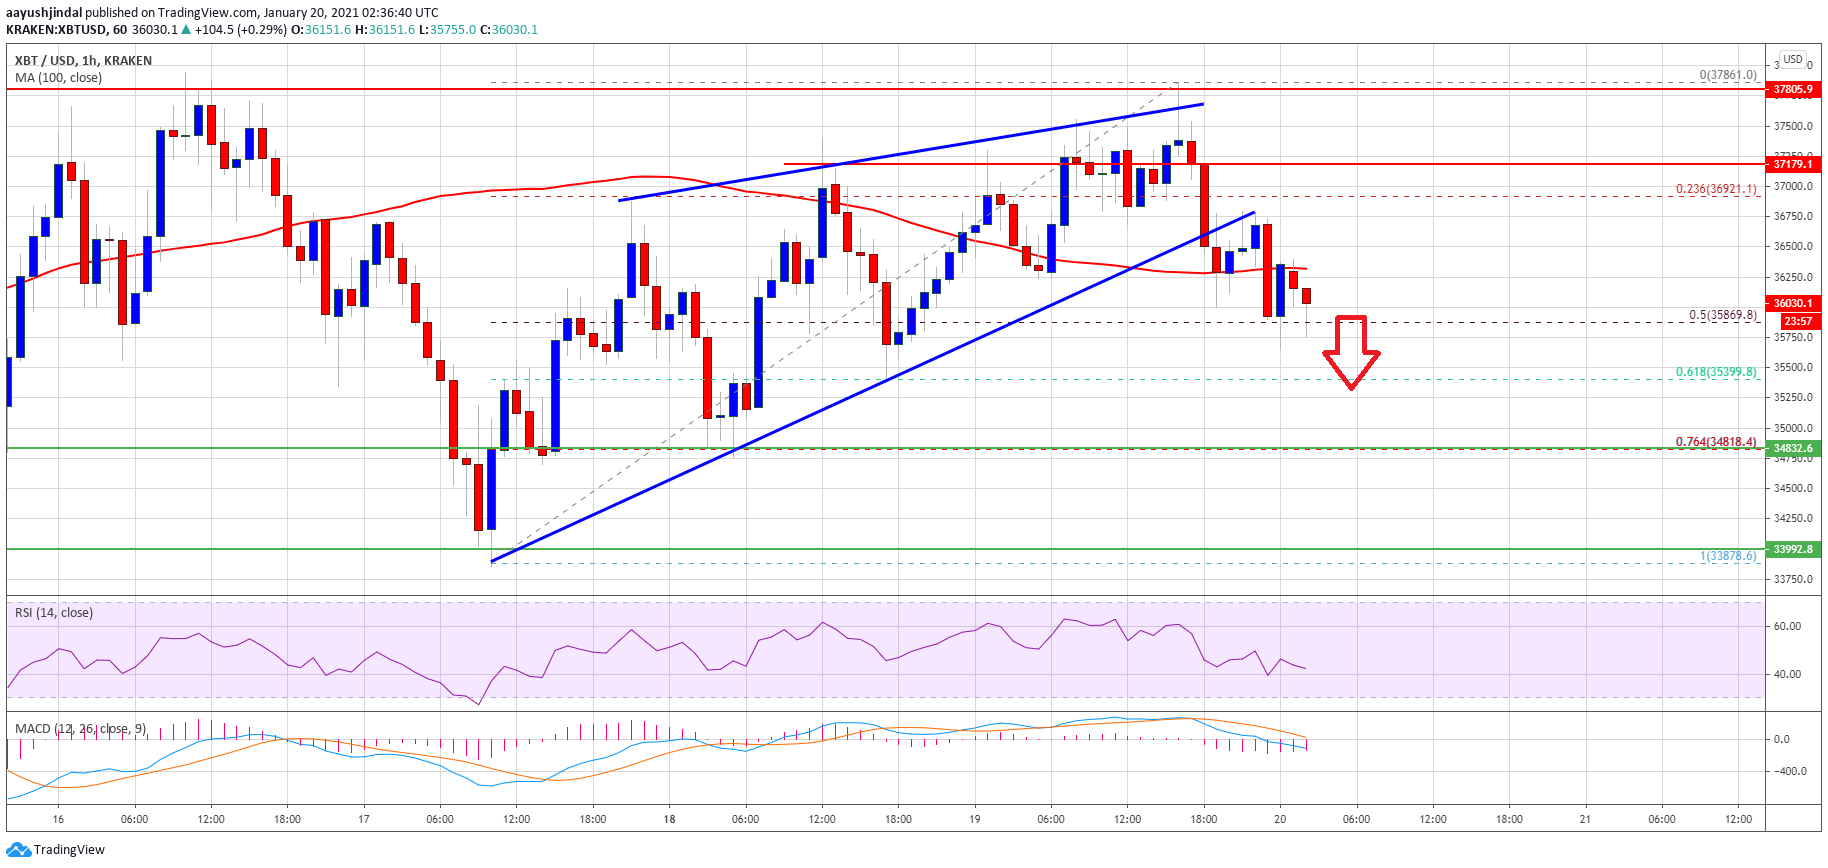
Source: BTCUSD on TradingView.com
If bitcoin price fails to stay above the $38,850 support, it could continue to move down towards $35,000. The next major support is near the $34,800 level, below which the price is likely to decline towards the $33,200 support zone in the coming sessions.
Fresh Increase in BTC?
If bitcoin starts a fresh upward move, an initial resistance is near the $36,350 level and the 100 hourly simple moving average. The first major resistance is near the $36,800 level (the recent breakdown zone).
The main resistance on the upside is still above the $37,000 zone at $37,500 and $37,800. A successful close above the $37,000 resistance and then a follow up move above the $37,500 could open the doors for a larger increase I the near term.
Technical indicators:
Hourly MACD – The MACD is slowly gaining momentum in the bearish zone.
Hourly RSI (Relative Strength Index) – The RSI for BTC/USD is now well below the 50 level.
Major Support Levels – $35,800, followed by $34,800.
Major Resistance Levels – $36,800, $37,000 and $37,500.
Source: Read Full Article