Uniswap Struggles below $6.00 High and Could Fall to $4.15

Uniswap (UNI) price has been in a downtrend since July 29. Selling pressure on this cryptocurrency has reached bearish exhaustion.
Uniswap price long-term analysis: bearish
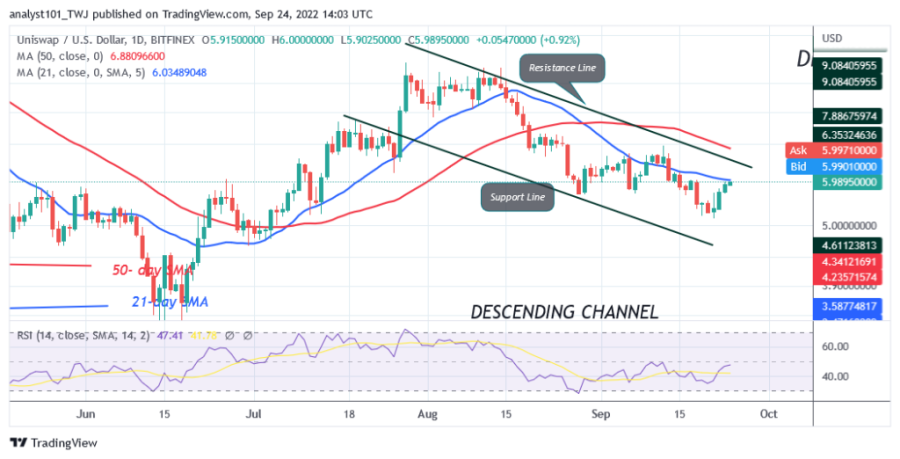
If buyers break the 21-day line SMA, UNI will resume its uptrend. The altcoin will rise to the 50-day line SMA. In other words, the bullish momentum will extend to the overriding resistance of $9.00. However, if UNI turns down from the 21-day line SMA, it will continue to fall to the low of $4.15. Meanwhile, UNI is trading at $5.96 as we write.
Uniswap indicator analysis

Uniswap is at level 46 on the Relative Strength Index for period 14, indicating that the cryptocurrency is trading in the bearish trend zone and is in a position to decline. UNI The price of the cryptocurrency is below the moving average lines, but a break above the 21-day line will signal the resumption of the uptrend. UNI is above the 40% area of the daily stochastic. This indicates that the altcoin is in a bullish momentum.
Technical Indicators
Key resistance zones: $12.00, $14.00, $16.00
Key support zones: $10.00, $8.00, $6.00
What is the next direction for Uniswap?
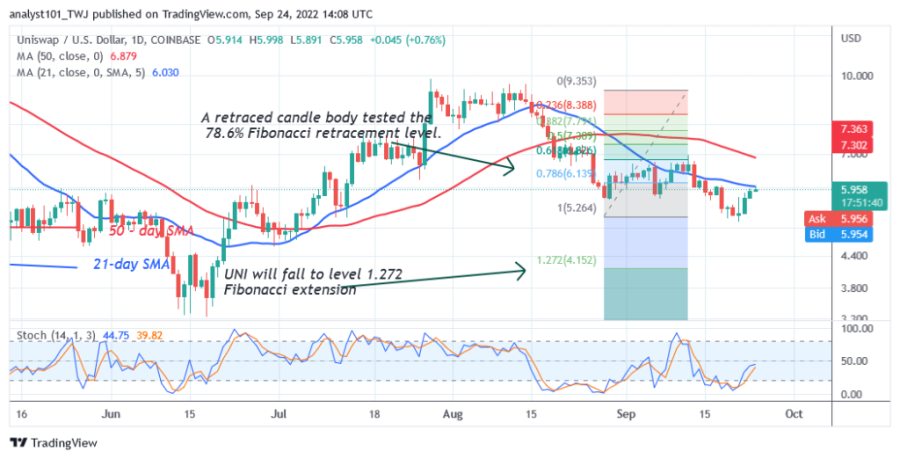
Uniswap is in a downtrend as it reaches bearish exhaustion. Meanwhile, on August 28 downtrend, a retraced candle body tested the 78.6% Fibonacci retracement level. The retracement suggests that UNI will fall to the level of the Fibonacci extension of 1.272 or to $4.15.
Disclaimer. This analysis and forecast are the personal opinions of the author and are not a recommendation to buy or sell cryptocurrency and should not be viewed as an endorsement by CoinIdol. Readers should do their research before investing in funds.
Source: Read Full Article